module 23 Economic Development, Consumption, and Sustainability
237
Human populations undergo change as a variety of natural and societal conditions in those populations change over time. Some of these changes occur with specific patterns that can be described and explained. In this module we will look at demographic transitions, the effect of these transitions on the environment, and the relationship between economic development and sustainability.
Learning Objectives
After reading this module you should be able to
describe how demographic transition follows economic development.
explain how relationships among population size, economic development, and resource consumption influence the environment.
describe why sustainable development is a common but elusive goal.
Demographic transition follows economic development
As we saw in Module 22, populations in different countries change over time and the population of Earth has also fluctuated. Demographers are interested in understanding the reasons behind fluctuations in population growth in the past and whether they apply to contemporary or future demographic issues. We will begin this module by looking at an important theory of how populations change. We will also look at family planning because it is an important component of demographic transition.
The Theory of Demographic Transition
Theory of demographic transition The theory that as a country moves from a subsistence economy to industrialization and increased affluence it undergoes a predictable shift in population growth.
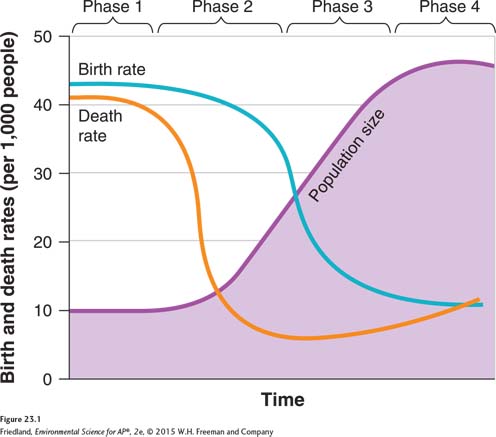
Historically, nations that have gone through similar processes of economic development have experienced similar patterns of population growth. Scientists who studied the population growth patterns of European countries in the early 1900s described a four-
238
The theory of demographic transition, while helpful as a learning tool, does not adequately describe the population growth patterns of some developing countries either today or during the last quarter-
Despite the limitations of the theory of demographic transition, it is worth examining in more detail because it allows us to understand the way some countries influence the environment as they undergo growth and development.
Phase 1: Slow Population Growth
Phase 1 represents a population that is nearly at steady state. The size of the population will not change very quickly because high birth rates and high death rates offset one another. In other words, CBR equals CDR. This pattern is typical of countries before they begin to modernize. In these countries, life expectancy for adults is relatively short due to difficult and often dangerous working conditions. The infant mortality rate is also high because of disease, lack of health care, and poor sanitation. In a subsistence economy, where most people are farmers, having numerous children is an asset. Children can do jobs such as collecting firewood, tending crops, watching livestock, and caring for younger siblings. With no social security system, parents also count on having many children to care for them when they become old.
Western Europe and the United States were in phase 1 before the Industrial Revolution, which began in the late eighteenth century. Today, crude birth rates exceed crude death rates in almost every country, so even the poorest nations have moved beyond phase 1. However, an increase in crude death rates due to war, famine, and diseases such as AIDS has pushed some countries back in the direction of phase 1. For example, a decade ago, Lesotho (CBR= 26, CDR = 28 in 2005) moved back into phase 1 as a result of its high death rate.
Phase 2: Rapid Population Growth
In phase 2, death rates decline while birth rates remain high and, as a result, the population grows rapidly. As a country modernizes, better sanitation, clean drinking water, increased access to food and goods, and access to health care, including childhood vaccinations, all reduce the infant mortality rate and CDR. However, the CBR does not markedly decline. Couples continue to have large families because it takes at least one generation, if not more, for people to notice the decline in infant mortality and adjust to it. This is another example of population momentum. It also takes time to implement educational systems and birth control measures.
A phase 2 country is in a state of imbalance: Births outnumber deaths. India is in phase 2 today. The United States population exhibited a phase 2 population pyramid in the early twentieth century when there were high birth rates, low death rates, and a large total fertility rate.
Phase 3: Stable Population Growth
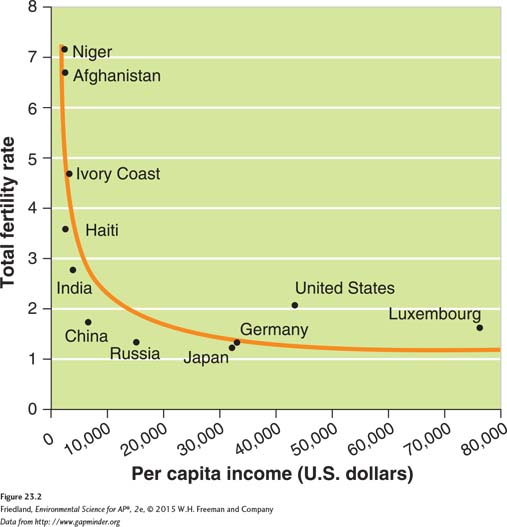
A country enters phase 3 as its economy and educational system improve. In general, as family income increases, people have fewer children, as FIGURE 23.2 shows. As a result, the CBR begins to fall. Phase 3 is typical of many developed countries, including the United States and Canada.
Affluence The state of having plentiful wealth including the possession of money, goods, or property.
Why do people produce fewer children as their income increases? As societies transition from subsistence farming to more complex economic specializations, having large numbers of children may become a financial burden rather than an economic benefit. Relative affluence, more time spent pursuing education, and the availability of birth control increase the likelihood that people will choose to have smaller families. However, it is important to note that cultural, societal, and religious norms may also play a role in birth rates.
239
As birth rates and death rates decrease in phase 3, the system returns to a steady state. Population growth levels off during this phase, and population size does not change very quickly, because low birth rates and low death rates cancel each other out.
Phase 4: Declining Population Growth
Phase 4 is characterized by declining population size and often by a relatively high level of affluence and economic development. Japan, the United Kingdom, Germany, Russia, and Italy are phase 4 countries, with the CBR well below the CDR.

The declining population in phase 4 means fewer young people and a higher proportion of elderly people (FIGURE 23.3). This demographic shift can have important social and economic effects. With fewer people in the labor force and more people retired or working part-
Recent studies on demographic shifts in highly developed countries suggest that the TFR actually increases after reaching a low point between 1.2 and 1.5. The reasons for this increase are unclear, but it appears that when a population becomes affluent and well educated, it becomes somewhat easier for women to raise children, and they choose to do so in slightly greater numbers. Such a pattern is occurring in Norway, Italy, the United States, and other developed nations.
Family Planning
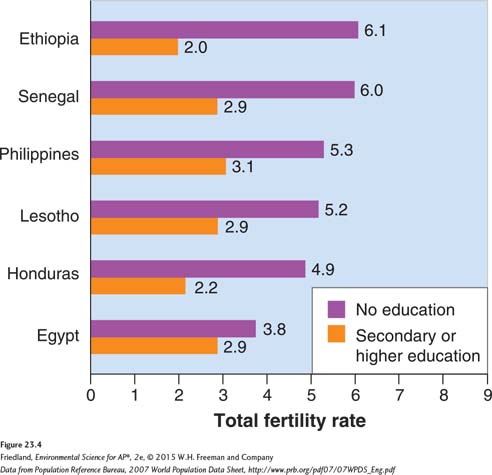
We have already observed that as family income increases, people tend to have fewer children. In fact, there is a link between higher levels of education and affluence among females, in particular, and lower birth rates. As the educational levels of women increase and women enter the workplace, fertility generally decreases. Even in developed countries where the TFR has increased slightly after hitting its apparent low point, women have fewer children than those in developing countries. Educated and working women tend to have fewer children than other women, and many delay having children because of the demands of school and work. Having a first child at an older age means that a woman is likely to have fewer children in her lifetime.
Family planning The practice of regulating the number or spacing of offspring through the use of birth control.
Women with more education and income also tend to have more access to information about methods of birth control, they are more likely to interact with their partners as equals, and they may choose to practice family planning with or without the consent of their partners. Family planning is regulation of the number or spacing of offspring through the use of birth control. When women have the option to use family planning, crude birth rates tend to drop. FIGURE 23.4 shows how female education levels correlate with crude birth rates. In Ethiopia, for instance, women with a secondary school education or higher have a TFR of 2.0, whereas the TFR among uneducated women is 6.1.
240
There have been many examples of effective family planning campaigns in the last few decades. In the 1980s, Kenya had one of the highest population growth rates in the world, and its TFR was almost 8. By 1990, its TFR was about 4—
Thailand also successfully used family planning campaigns to lower its growth rate and TFR. Beginning in 1971, national population policy encouraged married couples to use birth control. Contraceptive use increased from 15 to 70 percent, and within 15 years the population growth rate fell from 3.2 to 1.6 percent. Today, Thailand’s growth rate is 0.6 percent, among the lowest in Southeast Asia. Some of the credit for this hugely successful reduction in the growth rate is given to a creative and charismatic government official who gained a great deal of attention, in part by handing out condoms in public places.
Population size, economic development, and consumption interact to influence the environment
Both population size and the amount of resources each person uses are critical factors that determine the impact of humans on Earth. Every human exacts a toll on the environment by eating, drinking, generating waste, and consuming products. Even relatively simple foods such as beans and rice require energy, water, and mineral resources to produce and prepare. Raising and preparing meat requires even more resources: Animals require crops to feed them as well as water and energy resources. Building homes, manufacturing cars, and making clothing and consumer products all require energy, water, wood, steel, and other resources. These and many other human activities contribute to environmental degradation.
Both population and economic development contribute to the consumption of resources and to human impact on the environment. In this section we will examine how relationships among population size, economic development, and resource consumption influence the environment. We will then look more closely at local, urban, and global impacts.
Resource Use
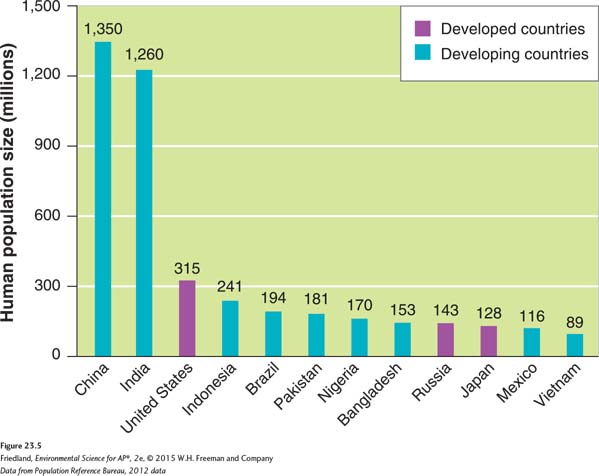
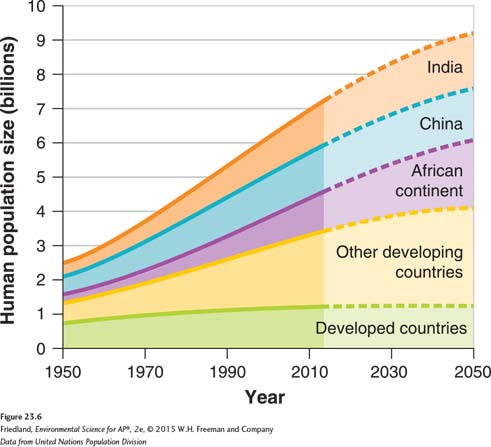
In Module 22 we described developing countries as those with relatively low levels of industrialization and incomes of less than $3 per person per day. In contrast, developed nations have relatively high levels of both industrialization and income. Of Earth’s 7.2 billion human inhabitants, roughly 6.0 billion live in developing countries, and 1.2 billion live in developed countries. As FIGURE 23.5 shows, 9 of the 12 most populous nations on Earth are developing countries. FIGURE 23.6 charts the relationship between economic development and population growth rate for developing nations. Populations in developing parts of the world have continued to grow relatively rapidly, at an average rate of 1.4 percent per year. At the same time, populations in the developed world have almost leveled off, with an average growth rate of 0.1 percent per year. Impoverished countries are increasing their populations more rapidly than are affluent countries.
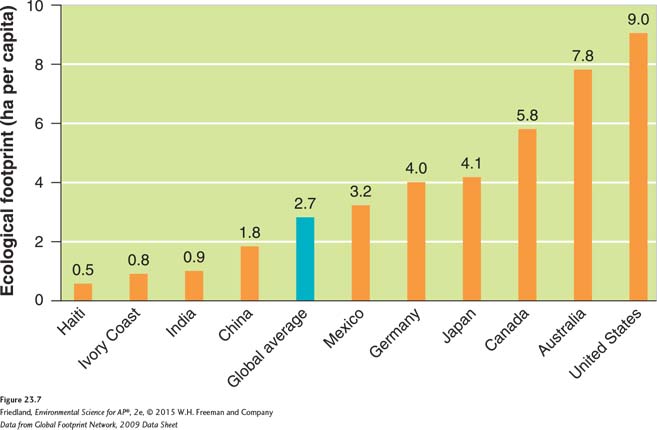
Differences in resource use are striking in terms of how population and wealth affect the environment. Calculating the per capita ecological footprint for a country provides a way to measure the effect of affluence—
241
In addition to looking at data on a per capita basis, it is useful to examine the footprints of entire countries. We can do this by multiplying the per capita ecological footprint of a country by the number of people in the country. We find that the United States has a footprint of 2,810 million hectares (6,944 million acres). China’s footprint is 2,790 million hectares (6,894 million acres), and Ivory Coast (in western Africa) has a footprint of 18.6 million hectares (46.0 million acres). Looked at another way, the United States, with only one-
The IPAT Equation
242
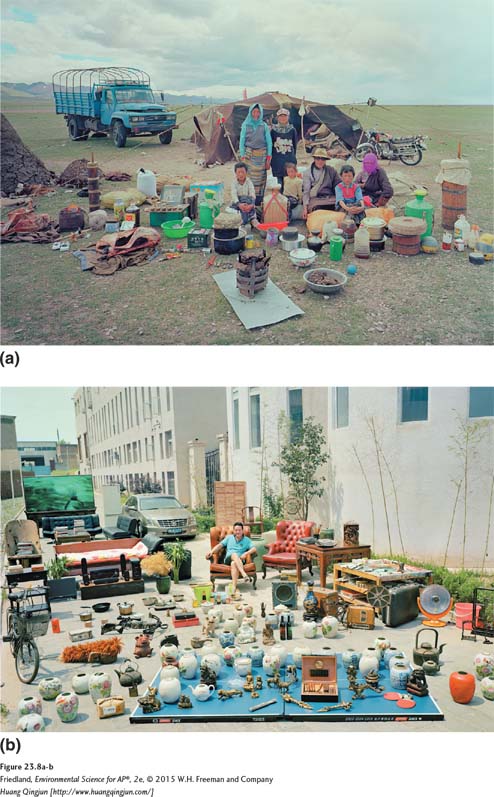
The total environmental impact of 7.2 billion people is hard to appreciate and even more difficult to quantify. Some people consume large amounts of resources and have a negative impact on environmental systems, while others live much more lightly on the land (FIGURE 23.8). Living lightly can be intentional, as when people in the developed world make an effort to live “green,” or sustainably. But it can also be unintentional, as when poverty prevents people from acquiring material possessions or building homes.
IPAT equation An equation used to estimate the impact of the human lifestyle on the environment: Impact = population × affluence × technology.
To estimate the impact of human lifestyles on Earth, environmental scientists Barry Commoner, Paul Ehrlich, and John Holdren developed the IPAT equation
impact = population × affluence × technology
Although it is written mathematically, the IPAT equation is a conceptual representation of the three major factors that influence environmental impact. Impact in this context is the overall environmental effect of a human population multiplied by affluence, multiplied by technology. It is useful to look at each of these factors individually.
Population has a straightforward effect on impact. All else being equal, two people consume twice as much as one. Therefore, when we compare two countries with similar economic circumstances, the one with more people is likely to have a larger impact on the environment.
Affluence is created by economic opportunity and does not have as simple a relationship to impact as population does. One person in a developed country can have a greater impact than two or more people in a developing country. A family of four in the United States that owns two large sport utility vehicles and lives in a spacious home with a lawn and swimming pool uses a much larger share of Earth’s resources than a Bangladeshi family of four living in a two-
The effect of technology is even more complicated. Technology can both degrade the environment and create solutions to minimize our impact on the environment. For example, the manufacturing of chlorofluorocarbons (CFCs) resulted in safe and effective refrigeration and air conditioning that was beneficial to human health, yet CFCs led to ozone destruction in the stratosphere. In contrast, the hybrid electric car helps to reduce the impact of the automobile on the environment because it has greater fuel efficiency than a conventional internal combustion vehicle. The IPAT equation originally used the term technology, but some scientists now use the term destructive technology to differentiate it from beneficial technologies such as the hybrid electric car.
The Impact of Affluence
Gross domestic product (GDP) A measure of the value of all products and services produced in one year in one country.
To help gauge a country’s wealth and its potential impact on the environment, environmental scientists often turn to the most commonly used measure of a nation’s wealth. Gross domestic product (GDP) is the value of all products and services produced in one year in one country. GDP is made up of four types of economic activity: consumer spending, investments, government spending, and exports minus imports. A country’s per capita GDP often correlates with its pollution levels. At very low levels of per capita GDP, industrial activity is too low to produce much pollution; the country uses very little fossil fuel and generates relatively little waste. Many developing countries fit this pattern.
243
As GDP increases, a nation begins to be able to afford to burn fossil fuels, especially coal, which, although relatively inexpensive, emits a substantial amount of pollution. The country may also rely on rudimentary, inefficient equipment that emits large amounts of pollutants. It is at this point in its development that a country emits pollution at the highest levels. The United States fit this pattern during the twentieth century. China, which is going through a similar rapid industrialization, currently relies on coal as its primary energy source. Many people view this shift as a trade off that occurs as a country’s GDP increases: Breathing dirty air poses a different risk to human health than poverty. Although it is not always a more desirable risk, many people would choose dirty air over poverty.
As a nation’s GDP increases further, it may reach a turning point. It can afford to purchase equipment that burns fossil fuels more efficiently and cleanly, which helps to reduce the amounts and types of pollution generated. People may also be willing to expend resources and support government efforts to regulate polluting industries. Wealthier societies are also able to afford better policing and enforcement mechanisms that ensure environmental regulations are being followed. Western European countries and the United States fit this scenario today. We will explore this turning point in more depth in Chapter 20.
Some environmental scientists argue that increasing the GDP of developing nations is the best way to save the environment, for at least two reasons. First, as we have seen, rising income generally correlates with falling birth rates, and a reduced population size should lead to a reduction in environmental impact. Second, wealthier countries can afford to make environmental improvements and increase their efficiency of resource use.
Local versus Global Impacts, and Urban Impacts
Impacts on the environment may occur locally—
Local versus Global
In general, highly localized impacts are typical of rural, agriculturally based societies. Most of the materials consumed in developing countries are produced locally. While this may benefit the local economy, it can lead to regional overuse of resources and environmental degradation. Chapter 3 described deforestation in Haiti as an example of such overuse.
Two commonly overused local resources are the land itself and woody biomass from trees and other plants. A growing population requires increasing amounts of food. In developing countries that do not import their food, local demand for agricultural land increases with population size. To put more land into cultivation, farmers may convert forests or natural grasslands into cropland.
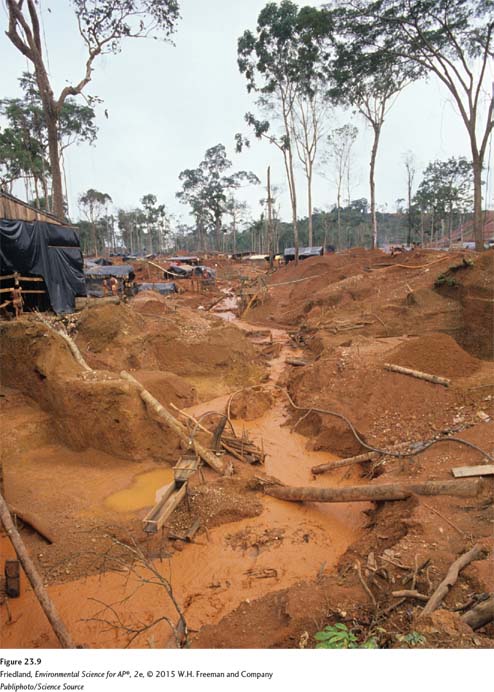
Brazil provides an example of land overuse in a developing nation. The United Nations Food and Agriculture Organization estimates that in Brazil, approximately 3 million hectares (7.4 million acres) were cleared per year during the peak years between 2000 and 2005. Some of this land was used for small-
244
Global impacts are more common in affluent or urban societies because they tend to specialize production in the industrial and high technology sectors. For example, more than half the ecological footprint of the United States comes from its use of fossil fuels, of which approximately 50 percent are imported. China’s ecological footprint has more than doubled since 1970, and its ratio of local to global impact has shifted. Most of its ecological footprint was previously driven by demand for food, fiber crops such as cotton, hemp, and flax, and woody biomass. However, in recent years, China’s demand for fossil fuels has increased dramatically.
Families in suburban areas of developed countries such as the United States consume far fewer local resources than rural families in developing countries, but they have a much greater impact on the global environment. In general, populations with large global impacts tend to deplete more environmental resources. Much of the impact comes from consumption of imported energy sources such as oil and other imported resources such as food. When people are affluent, they are more likely to purchase imported bananas, fish, and coffee from other countries, drive long distances in automobiles that were manufactured in factories hundreds or thousands of miles away, and live in homes surrounded by lawns that require large quantities of water, fertilizer, and pesticides.
Urban Impacts
Urban area An area that contains more than 385 people per square kilometer (1,000 people per square mile).
Urban populations represent one-
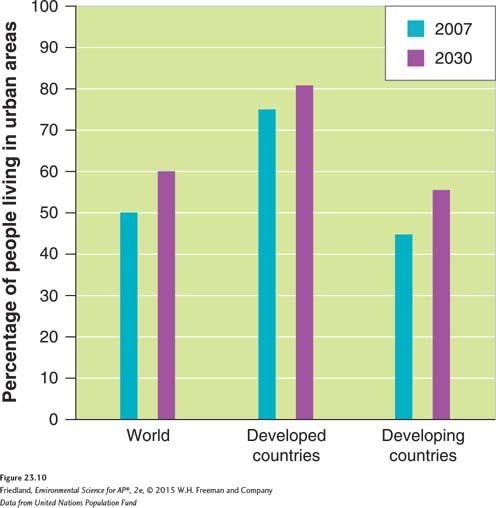
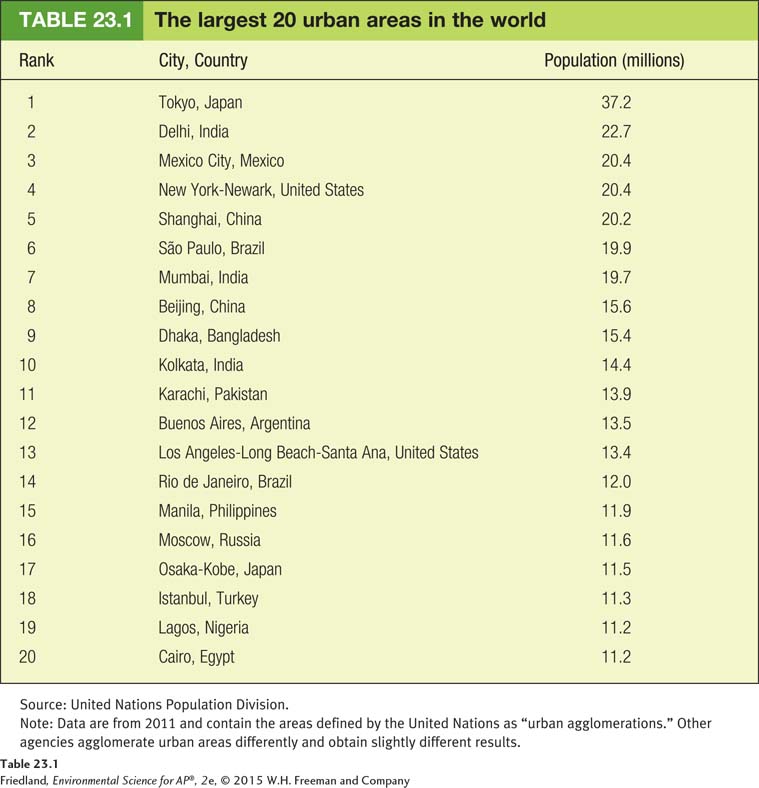
More than 75 percent of people in developed countries live in urban areas, as FIGURE 23.10 shows, and that number is expected to increase slightly over approximately the next 20 years. In developing countries, 44 percent of people live in urban areas, but that number is increasing more rapidly than in developed countries and will probably reach 56 percent by 2030. TABLE 23.1 shows that, of the 20 largest cities in the world, 16 are in developing countries. Worldwide, almost 5 billion people are expected to live in urban areas by 2030.
Urban living in both developed and developing countries presents environmental challenges. Most developed countries employ city planning to some degree. As urban areas expand, experts design and install public transportation facilities, water and sewer lines, and other municipal services. In addition, while urban areas produce greater amounts of solid waste, pollution, and carbon dioxide emissions than suburban or rural areas, they tend to have smaller per capita ecological footprints. There are many reasons for this difference, including greater access to public transportation and services that are nearby, such as shopping.
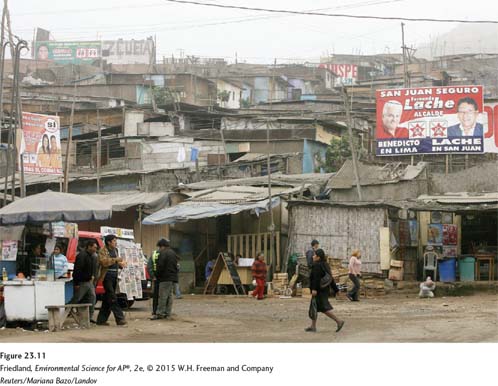
In developing countries, the relatively affluent portions of urban areas have safe drinking water, sewage treatment systems, and systems for disposal of household solid waste to minimize their impact on the surrounding environment. However, many less-
245
Sustainable development is a common, if elusive, goal
We have seen that economic development and advancement improve human well-
As we saw in Chapter 1, sustainable development goes beyond economic development to meet the essential needs of people in the present without compromising the ability of future generations to meet their needs. In other words, sustainable development strives to improve standards of living—
246
How can sustainable development be achieved? There are no simple answers to that question, nor is there a single path that all people must follow. The Millennium Ecosystem Assessment project, completed in 2005, offers some insights. This project’s reports constitute a global analysis of the effects of the human population on ecosystem services such as clean water, forest products, and natural resources. They are also a blueprint for sustainable development. The reports, prepared at the request of the United Nations, concluded that human demand for food, water, lumber, fiber, and fuel has led to a large and irreversible loss of biodiversity. The Millennium Ecosystem Assessment drew several other conclusions:
Ecosystem sustainability will be threatened if the human population continues along its current path of resource consumption around the globe.
The continued alterations to ecosystems that have improved human well-
being (greater access to food, clean water, suitable housing) will also exacerbate poverty for some populations. If we establish sustainable practices, we may be able to improve the standard of living for a large number of people.
The project’s reports state that “human actions are depleting Earth’s natural capital, putting such strain on the environment that the ability of the planet’s ecosystems to sustain future generations can no longer be taken for granted.” They further suggest that sustainability, as well as sustainable development, will be achieved only with a broader and accelerated understanding of the connections between human systems and natural systems. This means that governments, nongovernmental organizations, and communities of people will have to work together to raise standards of living while understanding the impacts of those improvements on the local, regional, and global environments.