Chapter 7 AP® Environmental Science Practice Exam
250
Section 1: Multiple-
Choose the best answer for questions 1–
Question 1
1. Which of the following does NOT support the theory that humans can devise ways to expand their carrying capacity on Earth?
The development of CFCs for use in refrigeration
The development of hydraulic fracturing to reach natural gas reserves
The use of arrows for hunting animals
The use of horse-
driven plows The use of waste methane from landfills for electricity generation
Question 2
2. A metropolitan region of 100,000 people has 2,000 births, 500 deaths, 200 emigrants, and 100 immigrants over a 1-
1.2 percent.
1.4 percent.
1.6 percent.
1.8 percent.
2.0 percent.
Question 3
3. Which of the following pairs of indicators best reflects the availability of health care in a country?
Crude death rate and growth rate
Crude death rate and crude birth rate
Growth rate and life expectancy
Infant mortality rate and crude death rate
Infant mortality rate and life expectancy
Question 4
4. In 2013, the population of Earth was about _____ billion, with about _____ billion living in China.
6.1/1.1
6.1/1.2
6.3/1.4
7.1/1.2
7.1/1.4
Use the following age structure diagram to answer question 5.
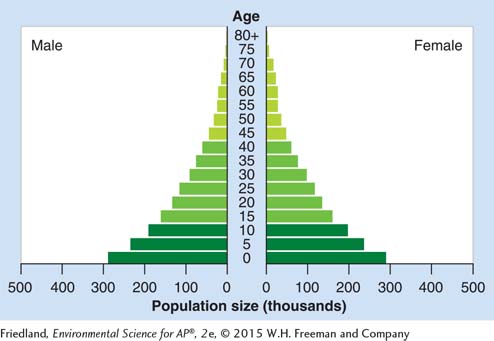
Question 5
5. A country with an age structure diagram like the one shown is most likely experiencing
a high life expectancy.
slow population growth.
a short doubling time.
a low infant mortality rate.
replacement-
level fertility.
Question 6
6. Which statement about total fertility rate is correct?
TFR is equal to the crude birth rate minus the crude death rate.
TFR is the average number of children each woman must have to replace the current population.
TFR is generally higher in developed countries than in developing countries.
TFR is equal to the growth rate of a country.
TFR is the average number of children each woman will give birth to during her childbearing years.
Question 7
7. Even if a country reduces its birth rate and maintains replacement-
lower death rates.
increased income.
population momentum.
better health care.
increased life expectancy.
Question 8
8. At current growth rates, which country will probably be the most populous in the world after 2050?
China
Brazil
India
Indonesia
United States
Question 9
9. Which characteristics are typical of developed countries?
High technology use
Low GDP
Small-
scale sustainable agriculture
I only
II only
I and III only
II and III only
I, II, and III
Question 10
10.What percentage of the world’s population lives in developing countries?
34
50
66
82
98
251
Question 11
11.Which country best exemplifies phase 4 of a demographic transition?
Argentina
China
India
Japan
Mexico
Question 12
12.As Brazil has become more developed and industrialized, its population growth has stabilized. At the same time, the use of technology and raw materials has increased to meet the demands of a wealthier and more prosperous population. This increased consumption is predicted by
Thomas Malthus.
the Millennium Ecosystem Assessment.
the theory of demographic transition.
the IPAT equation.
population momentum.
Section 2: Free-
Write your answer to each part clearly. Support your answers with relevant information and examples. Where calculations are required, show your work.
Question 1
1. Answer the following questions about the theory of demographic transition.
Draw a fully labeled diagram that shows how birth and death rates change as a country undergoes the four phases of a demographic transition. (3 points)
For each of the phases labeled in your diagram, explain the changes occurring in each phase and describe what is causing them. (3 points)
Describe a strategy that a government might implement to slow its population growth that could be utilized by a country undergoing a demographic transition. Explain how your proposed strategy would work, and describe one potential drawback to its implementation. (4 points)
Question 2
2. Look at the age structure diagrams for country A and country B below and answer the following questions.
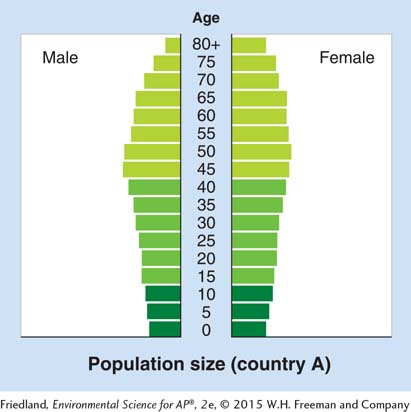
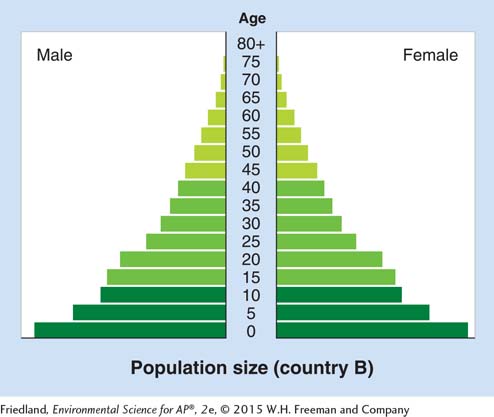
What observations and educated predictions can you make about the following characteristics of country A?
The age structure of its population (1 point)
The total fertility rate of the country (1 point)
The life expectancy of the population (1 point)
The growth rate and doubling time of the population (2 points)
Describe one socioeconomic feature of country A. (2 points)
Explain how country B differs from country A in terms of
the age structure of its population. (1 point)
its infant mortality rate. (1 point)
its rate of population growth. (1 point)