Chapter 1. Chapter 25 Branched Tutorial: Hardy-Weinberg
1.1 Problem Statement
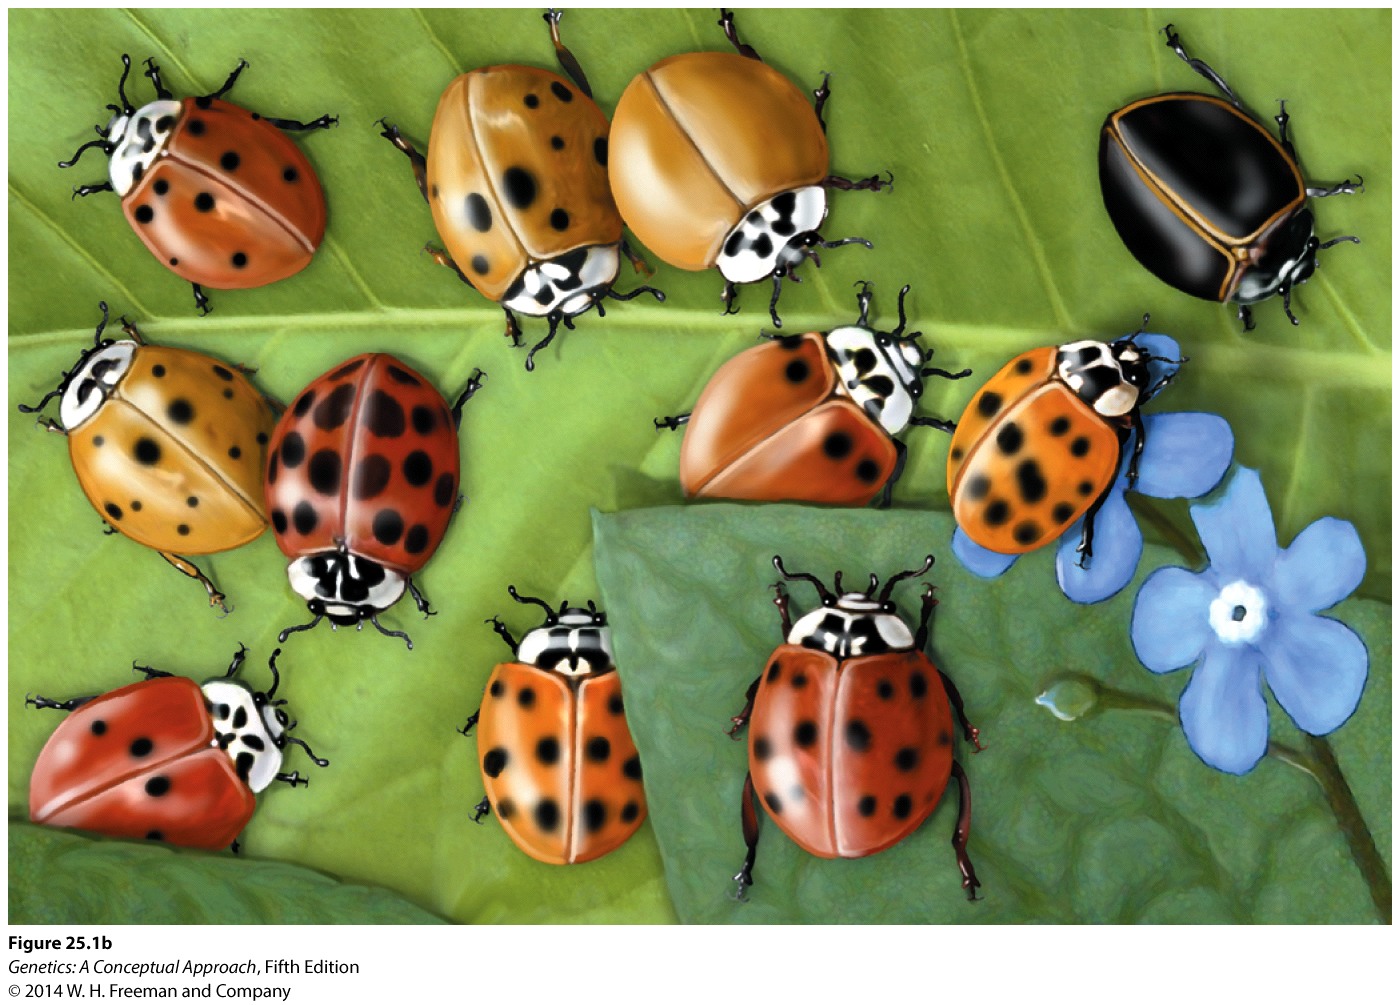
Assume that the phenotypes of lady beetles shown in the figure at the right are encoded by the following genotypes:
| Phenotype | Genotype |
|---|---|
| All black | BB |
| Some black spots | Bb |
| No black spots | bb |
For the lady beetles shown in the figure, calculate the frequencies of the genotypes and frequencies of the alleles. Determine if the population is in Hardy-Weinberg equilibrium by using a chi-square test. Be sure to round your answer to 2 decimal places.
Question
| Genotypes: | |
|---|---|
| Frequency of BBR9h13ZDLJFEjaB74 | |
| Frequency of Bbk/AlMDdOllpevBDJ | |
| Frequency of bbR9h13ZDLJFEjaB74 | |
| Alleles: | |
| Frequency of BJmLH/Y2b502ELXKE | |
| Frequency of bJmLH/Y2b502ELXKE |
Use a chi-square test to determine if the lady beetles shown are in Hardy Weinberg equilibrium.
Chi-square value = qdtJubbGyOI=
1.2 Problem Strategy
Question
Determine the best approach to solve this problem by ordering the following steps:
- Determine the allele frequencies in the population.
- Determine the genotypic frequencies in the population.
- Interpret the chi-square value.
- Identify the question that is being asked and focus on key pieces of information.
- Conduct a chi-square test.
- Determine the expected number of individuals in each class if the population is in Hardy-Weinberg equilibrium.
Instant TA
Think about the steps listed and how they logically flow from one to another, from general, information-gathering steps to more specific steps related directly to the question.
1.3 Step 1: Understanding the Problem
Question
njxir/ZNNOrT6mf1bVEbYcrIE5IdWzWXWFnrzHmKeEoCJjZUFnHjGKFaNf124T65e7lQIxY19FDBTwi9EjG+NU63w45v1R8JWsFgkZ8BaVVje4ceUeLrb8j/PtrBuR+OgUfVI7Sna5tee45JYpB0BcroQIA7/7VnJWrQh5ww4seUUodmqnIJvBHra/kBdaYawJvV+wX8jYgZ3wdvNbhCPxHNR6NeY+EfMX8SKMMOpWj7vcvlibypV4bhgANZtXe+AdpR7v1munOQy1zjpIG8vvSc0Cs2lsf+5OyPuaOUOlutXYWR0Z4r/JXYY5vsYhpu9Zc4Xih9oG+Dl7emhfx+TnT2XfE=Instant TA
You will need to count the total number of lady beetles in this population.
Question
6OQAwn6kqtuuPARAKtdj9pFz1qQErXYgrIIt6eTctRJpNR0xiXqh/PZtxAmJA/5TiC+D/l9IQrMrfLDI5PDOyAz9iDPShQDxUZRNDJ6Z9Upg6Diiz182uu4Q2dX0yE6A0NcKa0eYziaJxbCek3d1zhwXa6skvWQ6ody8DEETOvQmSdcXgwFfwVtkRYClyGZTlYzGS+zsFd6S1TZCyrffH13ehE3JUGBgeeDweJjXuY2a04xX0RE3UrAuu5Uthp7FFG1JvVg5drFexFKfFn4Y9pEIbwtyARZz/IN/GOd13VEIZjsbukslU06WwKxcPTZMfMqHSI6iot6uq3ycj2F3bqQGdKGSnZRVUsoC+pLSoFrfMIBY/nfiepZt49RkVvntd2fgTVYFTFIYUS3GInstant TA
Remember that each individual has two alleles.
1.4 Step 2: Calculating Genotypic Frequencies
Question
1. Indicate the total number of black lady beetles in the figure.
Number of black lady beetles = 0VV1JcqyBrI=
Instant TA
Use the displayed figure to count the total number of lady beetles that are all black.
Question
aKvtqMJxZNNIkUcH/F2zYRsKJW36JC605DlSt/kfEO/qpfegvyOBJcofa1jBYosNIAep9+SEXaHAvsPf6hp0OuyrXAyx6qhCVPZ42ik12kVU4/DPWM959Azpa/LKun47PynvCnAGX7YIh/eBaF6QoRSsezS3uSMraLWTovEO0hQSTEARYF53TBfTlqQ8b/4nqEbSp4GgeB8gBVMzyCTaME5Q7ZHJ+SegZhT5/KnMcPOyFMD6NVGp1Z2UHmiCMr1aRrBPJQMHUge5UbbH6JMWAuxb9I5WAnz/5QOQROfKVHTRQd8BFLufETqwwYyDkg2vOtrFkyhFJPbTj0OgiDV1LAvMopA=Instant TA
You can refer back to the original problem statement to review the assigned genotype for the all black phenotype.
Question
3. What is the frequency of the BB genotype in the figure? Be sure to round your answer to 2 decimal places.
Frequency of the BB genotype (as a decimal) = R9h13ZDLJFEjaB74
Instant TA
To calculate the frequency, you will need to divide the number of black lady beetles by the total number of lady beetles.
Question
4. Indicate the total number of lady beetles with some black spots.
Number of lady beetles with some black spots = Q3PdQ4iKdKE=
Instant TA
Use the displayed figure to count the total number of lady beetles that have some black spots.
Question
FN2Tqbkw48nUzq02YuOCOwGcHxyPoeeH3p8N1ZG6O+ndchHxLLuS2y5nIrQTGL3g8dzWWnq0Kxb1su0Y8PnvfdKJY+NwGilqszzt87F7ogdUlx3wOQDn2Onfx7grR7pl4uIlSsXQfaRlsc3Pj3tlCQo2ySC0HWdCpbMChrfndp1bpEMyMRASbLVZjFzBWSXIGRrNAQ0oRdYX5a9/VM8mVehHQRES4bM0K/ZXtfPig8nW2bmRrOTo01RIsFLYBBf59cYlLgQnxg/K/BvLLANWfhYhtFtIVkcUUBWx0zW4xKZ+XTvCn9rOO43mt5cYgbQwuv5pnX8OwTyraGSrInstant TA
You can refer back to the original problem statement to review the assigned genotype for the some black spots phenotype.
Question
6. What is the frequency of the Bb genotype in the figure? Be sure to round your answer to 2 decimal places.
Frequency of the Bb genotype (as a decimal) = k/AlMDdOllpevBDJ
Instant TA
To calculate the frequency, you will need to divide the number of lady beetles with some black spots by the total number of lady beetles.
Question
7. Indicate the total number of lady beetles with no black spots.
Number of lady beetles with no black spots = 0VV1JcqyBrI=
Instant TA
Use the displayed figure to count the total number of lady beetles that have no black spots.
Question
b3IEZGDyso1hPbcLYp37cCHigkIci2VXOE16i2csNSX7nlIxVdrjH2hCATgIv9ydBmjn4Fs/+0jJCuFOZ34gQ66Ucwqk7qNeqCRlwKlWyTUkX/xR4DQEkKMApWO7PXSN8nH3PW0VzHdPXNrhud8PduMvcMWezHoy5nju5BTWV30Y9L4RvB1XfBW1Akmbj/n6Wv8AeXy8WNvS6Ng7NJIDsRE8xy3u5vl1dMd1FR/kB7UlJCJyLg3maLoJrUpzjAm9JBYIiPW+zJtSJ4A+F8+3wPIs+WGzwhCb6xXgqoaapwOZKZtFWep4jpgFkJv/nkEBcmztwtoBcww58FSpInstant TA
You can refer back to the original problem statement to review the assigned genotype for the no black spots phenotype.
Question
9. What is the frequency of the bb genotype in the figure? Be sure to round your answer to 2 decimal places.
Frequency of the bb genotype (as a decimal) = R9h13ZDLJFEjaB74
Instant TA
Use the displayed figure to count the total number of lady beetles that have no black spots.
1.5 Step 3: Calculating Allele Frequencies
Question
1. Indicate the correct values for nBB, nBb, and N in the following equation:
p = f(B) = (2nBB + nBb)/2N
p will represent the frequency of the B allele. nBB and nBb represent the number of individuals of each genotype. N represents the total number of individuals in the population.
nBB = 0VV1JcqyBrI=
nBb = Q3PdQ4iKdKE=
N = cVy0Xs6Cud4=
Instant TA
Identify the number of individuals with genotype BB and genotype Bb.
More About This Equation
In this equation, the frequency of the B allele is being represented by p. In order to calculate p, the total number of B alleles and total number of alleles in the population are needed. 2nBB represents the number of B alleles in the homozygotes (remember, for each homozygous individual there are two alleles—this is why we multiply the number of individuals with genotype BB by two). nBb represents the total number of B alleles in the heterozygotes (since each individual only has one B allele, there is no need to multiply by any factor). 2N represents the total number of alleles in the population (each individual has two alleles at each locus).
Question
E0TfxbP33KITxKbspd/BPiJFGkzvCQ8pNt2rmBkbzU+YU2j+2bDZVnc6xfHd3eN/Y3ua8r6h5Ge9wPerE/lUMqWqlKdE4ZdR2ZAG6BgQxKFA30CKWQb3BO6DL8Z8BoNmlypef8xiw3BAPDwic0vFEO9jOqlSv27W1lvSuzmNRdt+m8c5lmELFaRsDvWxKl72ht02Ckd82UG88qa/CuzgMDMwtWLoNF2jMvWBDJWYISHwQ/aLBsB6TWggeGDRlH0BEjiiZ0lFn+QMDh6bRERLk9yo2yPAKp805Dh4RYp4sEC46nFEYzgPDViCpou0253J5Jo4Lw/TSdNCy8DispOEsb79GerGuuBSyuDFpGOb037zPPzp7kLCz2v+IvCBLL/MW2RX4JuU54SLrQBs68Lcnnxx085TCQ4YD1AY7YjBsMdm5crDGFhijkbu0q9Rrvp2V7tFYpy8SzpiNimLPYPfMd34DWQFNS3DOpaEZSgz5OmxA/6B3bdnIi1AJO8K1ezgsKcuhSn4livX/vP9tZCv/FlmptI=Instant TA
Use the equation p=f(B)= (2nBB + nBb)/2N to calculate the value of p.
Question
0R145tXs/AD8eato3m31EKopW5rzMTx2oZ4PbK6fQmJKry07h0mrHtxZm41QO5Lr2vNExnC0xwuiSjCvZQRQXdZGLn8oJ6P3UYl5QQU1WEVWTVMk5Hq5jIQoFjug8gULjdi9QIUTKFEk0Q1gkn7c2d7E5RJtITA1P/Ir2HQAAAFB8A0D3L/gViFhaebn7rjHOohpk1evs2ClrF+hzJ1yxe7RcjkWXuC2aHYtoLE+oDHM9elOqJpaPGAQXUpuKKbi288DXXcVyYe97tG5fFFG695IZ99zWpWvI8PoUNqES3NIuKBT6/cepfMyrNctD9CtmhIWYBBUR2HJwUFkcRXSPuVjLr1r24YFInzpqVAytJGxaSEGWvAQRuP89i0kopJajNoSqEwZJZ8FLAFJd1mJYC4KzYnTBQnjdYOx84EbMrs/1ByoTr6kTzwafFc=Instant TA
Because you have determined the value of p in the previous question, you can easily calculate the value of q using the equation p+q=1. The allele frequency of q should not be determined by calculating the square root of q2 since this value would only take into account the q alleles present in the homozygote; the q alleles present in the heterozygote would be missed.
1.6 Step 4: Calculating Expected Genotypic Frequencies for a Population in Hardy-Weinberg Equilibrium
Question
yRibGy9vbVQvXBlXOw7NWtPUPr9Ba3E7kGs1GSq4l9xGQ18ALZxYuj+1yONgzVSJ9So051GqsuAheUBZ7gS9NpQAq3x5CIzeh/lo375tzpkhzeSRAHYexGNeLeHYmf5uTP51rn4/992jTX9uwImU8u9+iCfpdR9W9/l87uMxWf+GLstbnbboZ1qyqziWrr2TCyTF5Hd4a1aRNQ5G6leQC4m9PMtb0cMD4jcG5gHphZcMm8i0Jps0gBvXzH2kOOYpUaCrBlLS2kxz51wuncC0mJtk2CPTvQQTFS1QsOMdnmZe5vI5KSVIhSBMwrJhKnt8brY5rmko/xA/+L7aBUnZm2sCqkRtv15esLwQRIBIi11+AX+tvpMFC8wGkpwrfr9vDMVuKYodSS4apPOhmGgujXWkuHrrVUOr9zisZyITcZKhoNuWB1YvjNKS+xawjqfvjKkTqeKCvoe4t5G/MPPXolbM3O05FlmohFrFNrschJsQhrIIemayBL9KKoKZsVxlY3wQ2x2igbcZFVW4jwzyotVirJAg71nUfW4ht/d/poluKNoZNvfLmJjHKPI3QijNInstant TA
We are letting p represent the frequency of the B allele. The BB genotype has 2 B alleles.
Question
THk5FJ3ROa5gNQ5t5GWdnWdWPHLp8d2LhIk4yGxTsVz5lDFhO9bY18i6xhGSEPh3f/uYTgHArFnV6tRf7sF69omZJCL316+O8z4iT+WguMCWhKA3+wF/b4dwqq/cF2g8kElSgw8X5oS6ImglcdRV0pxhPE/mxHHS1xYUnGhH2Kf3Ehnsv/aOkeRF6MIK34KcmOhRs9ZXb4wqGw09grus1HHIdZKHRSeJBFIPa096sk+cPoyyuXPwJlXIjtr1qEzKlTEfyKfKEsfshGyVFZYBfMbju57280Kln0hAAUtVNK9KcGRq4whP4Mf1LdFKfdNB/x+oMUDaIDG1+sL1ZBD/WGkQBN1wievdFAgF8DWy9Csd6nUKPBBSMA1PlZFpbRbZpXSnkcxA6esy2nwWp6ehFgZ5KBlHnNF/BG8NnnICBlP9Z8x9NPmXz6imGxdSr5QHi3Rq9Q==Instant TA
In the Hardy-Weinberg equilibrium equation, one expression represents the heterozygous individuals by combining the frequencies of the two different alleles. You will need to use your calculated p and q values to answer this question.
Question
PyJdXR/LmNWtiiiT8AgOnQ7jO8s6L3t+URNt9gWqGlHAos/2PS9L9ddCwxzHHyBUEltJZiWsSo4P/P44Xj3kkIVaoBpwI6Cdn6MEDiJuATIquGwZSxV32yLDLTApll6IwryBqOE8Sx9sF0UgsuibGwfA5SvLplf8IqEvgjjmNhTc1s23UFretGNPDUWBkkGwZTGm2ruPTFWhN1gh2364MMOL6y3sopNkOdMvSj5o3iztUQb491zJoSRxYa/MttFStJO2xrdFNxSe2oFKN38fIr5DzH5sVCC/L2Lfiq1CLaAmOmPl9+mIU1V57mWFk72eQywXqK2vyyxuudx3bU2kb2o+1rsrvB3GyOVfE5jicwLQw8cl6lVOs+n75NirGeFjETu5aZ/B9j98lhW6OthR/tGgBjE9n+bhXkg2WAhuLNvOpuibzRRKKzEbAiAO9dPtnDvc6urE/LeW25X68noHvQ==Instant TA
In the Hardy-Weinberg equilibrium equation, there are two expressions that represent the homozygous individuals. Be sure that you focus on the expression that represents the bb genotype. You will need to use your calculated p and q values to answer this question.
1.7 Step 5: Conducting a Chi-Square Test
Question
1. A table can help organize your calculations for the chi-square test. In the table, the letters A-E represent column headings. To provide the best approach to arriving at the final chi-square value, use the dropdown menus below to match the correct column heading title with the correct letter.
| A | B | C | D | E | |
|---|---|---|---|---|---|
| BB (all black) | |||||
| Bb (some black spots) | |||||
| bb (no black spots) |
(Observed - Expected)2/Expected LQx6pdvaKPImRccMCtLtwLAnW1w=
Expected mlliTBjMc64IHhcoxW5VpSRjXbY=
Observed e5iF0b+32fIz19kfYFTUoGAOfFs=
Observed - Expected Iec4lU4VSZepo7q1nFQ+Mn0rrzw=
(Observed - Expected)2 UVgMWl5GMSt5jZn1FKeLXPG1fp0=
Instant TA
The column indicated by “A” should include the information that is provided to you. In the remaining columns, you will work in a stepwise manner to obtain the values that will be used for the chi-square calculation.
Show Chi-Square Equation
χ2 = Σ(observed - expected)2 / expected
Question
2. Provide the observed number of individuals for each phenotype in the table below.
| O | E | (O-E) | (O-E)2 | (O-E)2/E | |
|---|---|---|---|---|---|
| BB (all black) | 0VV1JcqyBrI= | ||||
| Bb (some black spots) | Q3PdQ4iKdKE= | ||||
| bb (no black spots) | 0VV1JcqyBrI= |
Instant TA
The observed number of individuals can be obtained from the image of the lady beetles.
Show Chi-Square Equation
χ2 = Σ(observed - expected)2 / expected
Question
3. Provide the expected number of individuals for each genotype/phenotype if the population is in Hardy-Weinberg equilibrium. Be sure to round your answers to 2 decimal places.
| O | E | (O-E) | (O-E)2 | (O-E)2/E | |
|---|---|---|---|---|---|
| BB (all black) | 1 | 3sGI5g9iWPU= | |||
| Bb (some black spots) | 9 | GFhBRREqsjA= | |||
| bb (no black spots) | 1 | 3sGI5g9iWPU= |
Instant TA
Use the calculated frequencies from the Hardy-Weinberg equilibrium equation along with the total number of individuals in the population to arrive at your answer.
Show Chi-Square Equation
χ2 = Σ(observed - expected)2 / expected
Question
4. Provide the answer for the (observed – expected) calculation in the table below. Be sure to round your answer to 2 decimal places.
| O | E | (O-E) | (O-E)2 | (O-E)2/E | |
|---|---|---|---|---|---|
| BB (all black) | 1 | 2.75 | wXd1MgA238qCn1Ip | ||
| Bb (some black spots) | 9 | 5.50 | W4ye7+xCOkk= | ||
| bb (no black spots) | 1 | 2.75 | wXd1MgA238qCn1Ip |
Instant TA
Use the observed and expected numbers to calculate the values.
Show Chi-Square Equation
χ2 = Σ(observed - expected)2 / expected
Question
5. Provide the answer for the (observed – expected)2 calculation in the table below. Be sure to round your answer to 2 decimal places.
| O | E | (O-E) | (O-E)2 | (O-E)2/E | |
|---|---|---|---|---|---|
| BB (all black) | 1 | 2.75 | -1.75 | VR4qKmWFnek= | |
| Bb (some black spots) | 9 | 5.50 | 3.50 | iQNuxUjTrTKKX3cr | |
| bb (no black spots) | 1 | 2.75 | -1.75 | VR4qKmWFnek= |
Instant TA
Squaring the previously calculated value will provide you with a positive number.
Show Chi-Square Equation
χ2 = Σ(observed - expected)2 / expected
Question
6. Provide the answer for the (observed – expected)2/expected calculation in the table below. Be sure to round your answer to 2 decimal places.
| O | E | (O-E) | (O-E)2 | (O-E)2/E | |
|---|---|---|---|---|---|
| BB (all black) | 1 | 2.75 | -1.75 | 3.06 | VtsNOTS/VRA= |
| Bb (some black spots) | 9 | 5.50 | 3.50 | 12.25 | DpQpi7NtHD8= |
| bb (no black spots) | 1 | 2.75 | -1.75 | 3.06 | VtsNOTS/VRA= |
Instant TA
Since we are working step by step through this calculation, you will need to divide your last calculated values by the value that is expected.
Show Chi-Square Equation
χ2 = Σ(observed - expected)2 / expected
Question
7. Calculate the chi-square value for this problem. Be sure to round your answer to 2 decimal places.
Chi-square value = qdtJubbGyOI=
| O | E | (O-E) | (O-E)2 | (O-E)2/E | |
|---|---|---|---|---|---|
| BB (all black) | 1 | 2.75 | -1.75 | 3.06 | 1.11 |
| Bb (some black spots) | 9 | 5.50 | 3.50 | 12.25 | 2.23 |
| bb (no black spots) | 1 | 2.75 | -1.75 | 3.06 | 1.11 |
Instant TA
The chi-square value is a sum. Review the chi-square equation to determine which values in the table below need to be added together.
Show Chi-Square Equation
χ2 = Σ(observed - expected)2 / expected
1.8 Step 6: Interpreting the Chi-Square Value
Question
LESmmYHXs0y4ooGJ/sx/CkypOJ9ijLqrsQzE5YLE8kbtboc2c/4NcuHvJYk4IjiXx00ZQG73VpGM9R2tGwSGrXUq4L/jrQ+p/NkI27TCLoS2r6Jp0pFcD5DakYH7AaGa+K75l3A7QD4L7AfQYjix7A30DvCAOxw8j1zZ+P0lOo2hEh/gEQNB9NlFYN5BHK0awHkc7OZs2+MvFbuwzlzcXv/WA/NBZkHzwpANtqe8h5DFKsZThEYmf3ZkzOv6JInEttRNN8j6DNjE2DtRlTgb6waO6pHNrrsIEbmmAnHOboT/oL0U3FjJD5XdvMghx/edeUG3wIEnkZ8rn92VorjTK0Pb4ZYaCYwZJtCRfhCj+7m2hKFosx224aZUkDL4QjPutHR2gzt9HERwXOvBG4NciGj62m7wzHTncoifshc1XcdlYICTS+Z6JhruadeC7ImrQ5iDlaXJsWSS3v+HfYrUpe1CsZKKfe74uioeM7NTwPcTrlykM5l9qAm3FE5iaeiGOGRseMAWHLwuyXc8ljPKR94CjIOUnD9Ix01IlqSAG775OL/gkJiDFGDQz1DH00gfLjvPgMzRKoEies5dbwjox1uOBT6/MUcR3Zbr0bgzRTynwhK/haXP0Eqa1IRL0D311E/v04r+xQ4r4Nqpw83fX7h6ZKHdNm/TS+wh2lRaBW/oQqG2C5rtizGFo5M=Instant TA
Generally, the degrees of freedom for a chi-square test of Hardy–Weinberg equilibrium equal the number of expected genotypic classes minus the number of associated alleles.
Question
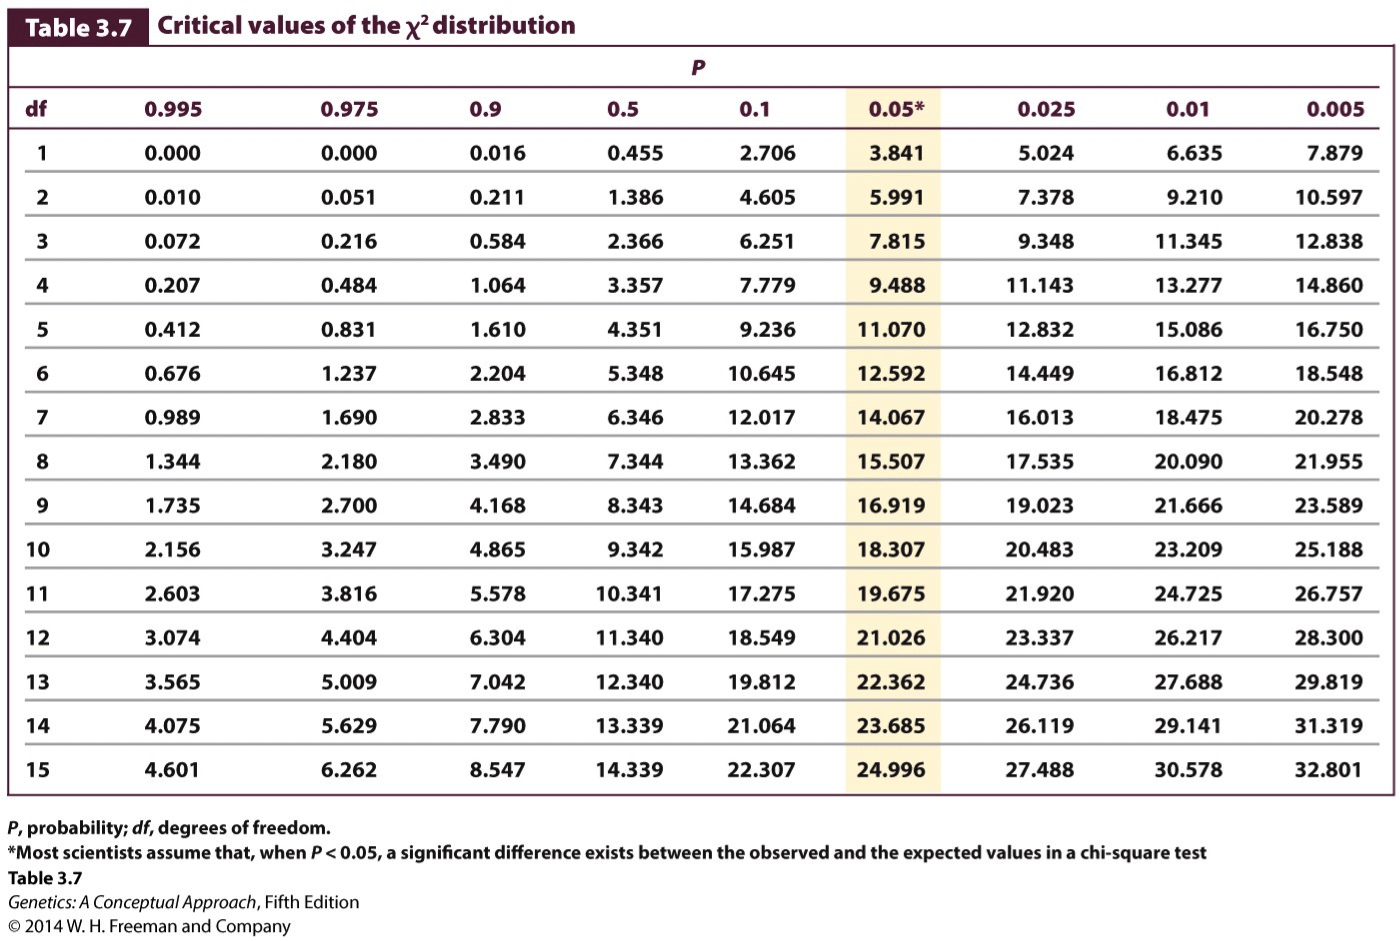
yqyH847xQLNODWUmyKaAUPgTpZu/uQ8pgTSUf5AgWFUOzkxCx/mXbcCdNTuj9GBKBmesmAqlgPf0U5ONLjMytm89dY8E9+sXnLTDWmJ/O+t+UXsT4hqD/XoA5XjUMfVJs2FsyH8Swh/JXB672S87knDpqOckL9vlVtVybhXPVlmZhxcm6pMTa6Lt4E5tACDBWDxSpqjFYBKmObQNCPtvV5mhesLd7WckUxeFHITBIomZl3IgLHBExjuGPDtMrTcGuQVbqkXfxLLhDCANprPjSHDNBvmKQyBH9ZJvUmvkYrT/8EQBpjG1um5vjcuOLhbiIoIrtd+rR+dV3WzHzysYTgRK2wiHetKIOJa8Ur2q1/MiFngyajWe7sDvEJGhdZAEJ2jbPdNzUVGTZZ9zBvR/8kHn1PVCzPjI90EihdSqMFs3uLQpnnVqCCM8mHo1ASJoq4sMiKsZ1/wvsQst/RCzUHAuLVjegrGNMeMFJGDaFWUh6Q7cT5uU/03NXJEJoWm1peWiQFJlR2D5Xkit4jRRgWNF5yh6hwlcEyDKn9rspab4dt0no59BGIyt8V4h2dvkRGaTk0AM/ESeOdn0j4mY4G8GdSfX4wPtIlfiyw==Instant TA
Use a chi-square distribution table to determine the probability value. The probability value is indicated by p value in the table.
Show Chi-Square Distribution Table
Question
eAh9yXZE0CNoaahWhDAGcSDFgRtRBWxSsye05s4ZGHSqI4ldt7Un1VEinN+rY9WqXkrv9HWmD3QWZp6XQMPxIs3Wqlt34D1oLHi5CgV5LzAgQSWwKFh3ojMwsK41V2xqzWvGBxz2OfhpW3aEbhw/Be1p4TKKlNPR7s9kiRKnL2IZPykwUp5irAlAGzVO4TGB6iR1pc7gUGRQ0epap9uP3iE3oKg/pNBizDZgmQNhzPUbAmJZpza0OBOCp8mmaOUWAtzsWS8nZOjdUqbFaOatSDL8ZB/lG4n3b8txILcp/uxUzKrMDp4uoC7ZVm8=Instant TA
The critical value for the 0.05 probability level from the chi-square distribution table is 3.84.