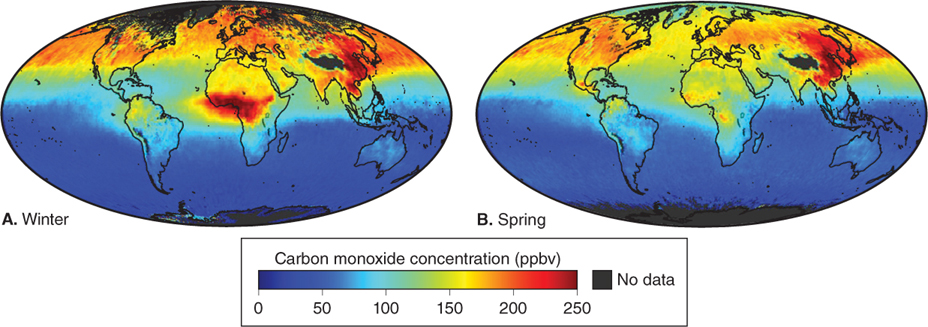
Anthropogenic carbon monoxide emissions. These false-color maps show CO concentrations, averaged over a four-year period (from January 2000 through June 2004), for (A) late winter and (B) late spring. Concentrations are given in parts per billion by volume (ppbv): blue areas have little or no CO, and red areas have the highest CO concentrations. High concentrations result mostly from either burning of fossil fuels in industrialized regions (such as the United States and southern Canada, Europe, and much of East Asia) or burning of agricultural waste or forests in developing regions (such as northern South America, central Africa, and Southeast Asia). Note that the Northern Hemisphere’s CO emissions are constant, while those in the Southern Hemisphere, which are mainly a result of seasonal burning of vegetation, vary more by season.