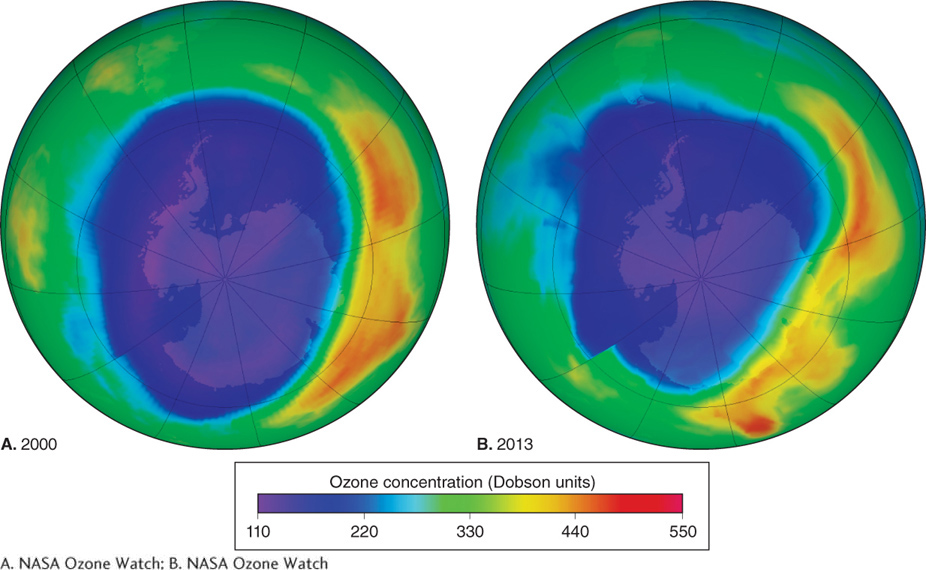
Figure 1.17
Thinning of the ozonosphere over Antarctica. Dobson units (DU) measure the concentration of ozone in the ozonosphere. Blues and purples show where there is the least ozone, and greens, yellows, and reds show a healthy ozonosphere. (A) This image was created on September 9, 2000, showing the largest ozone “hole” ever recorded for a single day: 29.9 million km2 (11.5 million mi2). (B) This September 16, 2013 image shows that thinning over Antarctica has become slightly less extensive since September 2000. The area of ozonosphere thinning peaked at 24 million km2 (9.3 million mi2) on this date.(A. NASA Ozone Watch; B. NASA Ozone Watch)