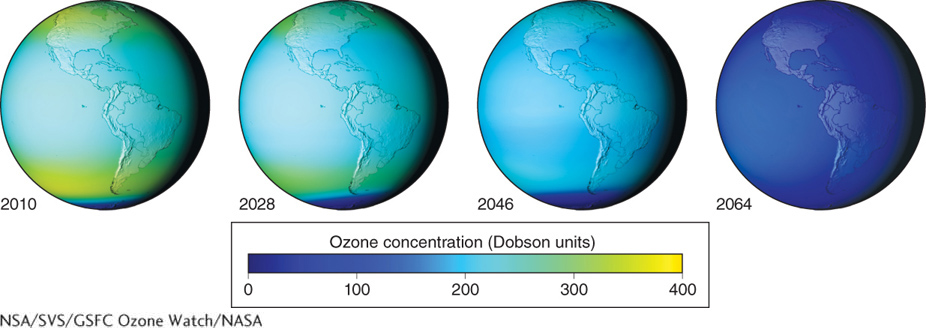
Figure 1.19
Thinning of global ozonosphere avoided. These images show the results of a computer modeling study based on the assumption that CFCs would continue to be manufactured. The 2010 globe on the left shows modeled stratospheric ozone concentrations (in light blue and green) at midlatitudes and the tropics. To the right, the globes show increasingly lower ozone concentrations (in dark blue) over time. If the manufacture of CFCs had continued, ozone concentrations could have dropped to zero just after the middle of the twent(NSA/SVS/GSFC Ozone Watch/NASA)