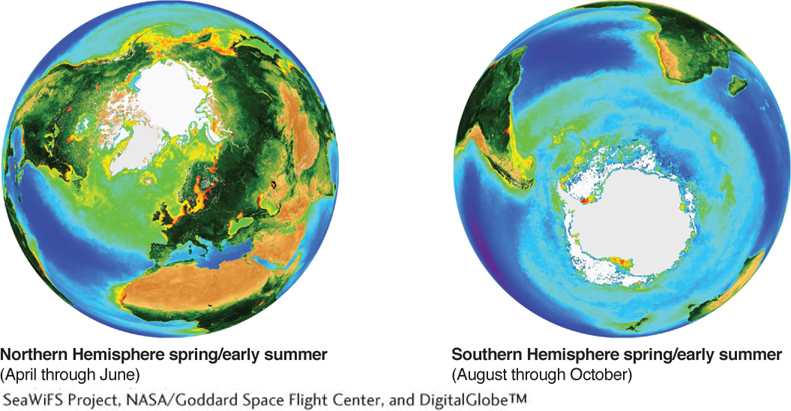
Figure 10.25
Phytoplankton productivity. Phytoplankton blooms are shown in green, yellow, orange, and red over the oceans. Blue areas have the lowest phytoplankton activity, and red areas have the highest. Note the concentration of phytoplankton activity at high latitudes.(Sea WiFS Project, NASA/Goddard Space Flight Center, and DigitalGlobe™)