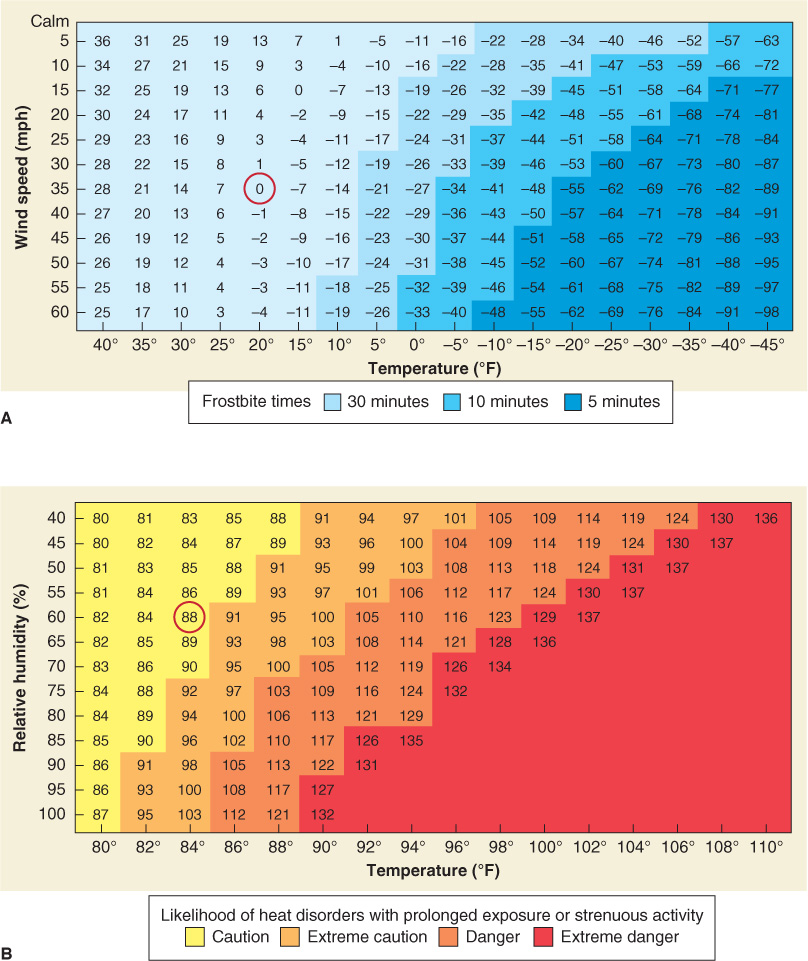
Wind chill and heat-index charts. (A) The wind chill temperature at a particular measured air temperature and wind speed can be determined by using this wind chill chart. A measured air temperature of 20°F (horizontal axis) and a 35 mph wind (vertical axis), for example, create a wind chill temperature of 0°F (circled in red). The chart also shows frostbite times for exposed skin. In the purple region, frostbite occurs within 5 minutes of exposure. (B) The heat-index temperature at a particular measured air temperature and relative humidity can be determined by using this heat-index chart. A measured air temperature of 84°F (horizontal axis) and a relative humidity of 60% (vertical axis) create a heat-index temperature of 88°F (circled in red).