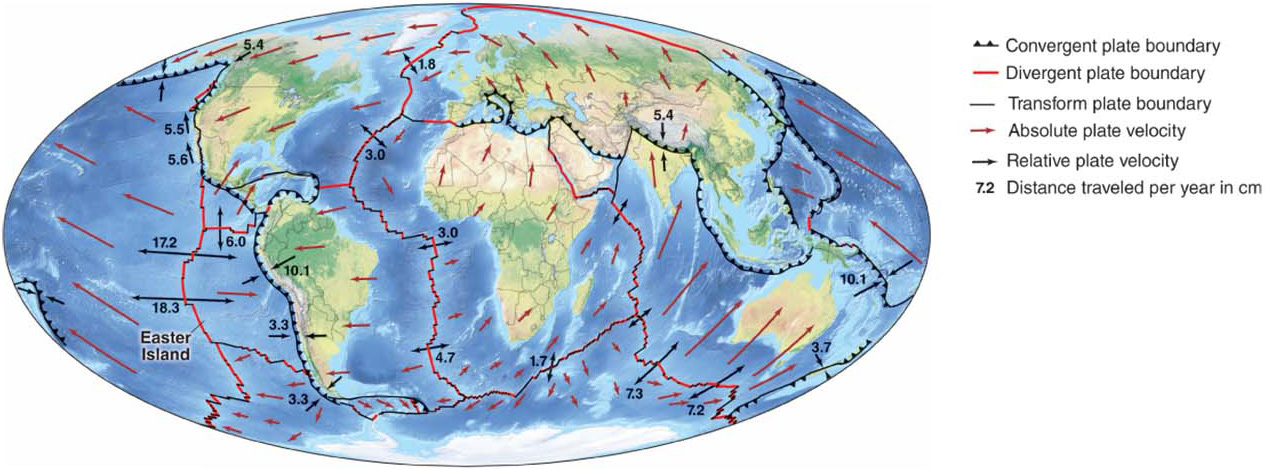
Figure 12.10
Plate movement velocity. Each of the 14 lithospheric plates moves independently and at a different speed. Red arrows show absolute plate velocities; blue arrows show relative plate velocities. Longer arrows indicate faster movement. The numbers are distances traveled each year in centimeters. Symbols for different types of plate boundaries are given to the right of the map: Triangles show where plates converge. Red lines show where plates diverge. Thin black lines show where plates slip past one another sideways in transform movement.