Figure 15.35
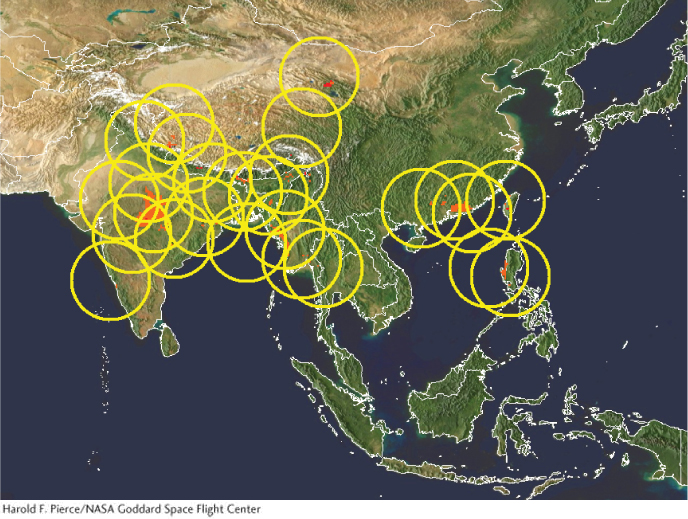
TRMM map of potential landslide areas. This map shows landslide risks for South Asia for August 22, 2013. This map is based on(Harold F. Pierce/NASA Goddard Space Flight Center)
Figure 15.35
TRMM map of potential landslide areas. This map shows landslide risks for South Asia for August 22, 2013. This map is based on