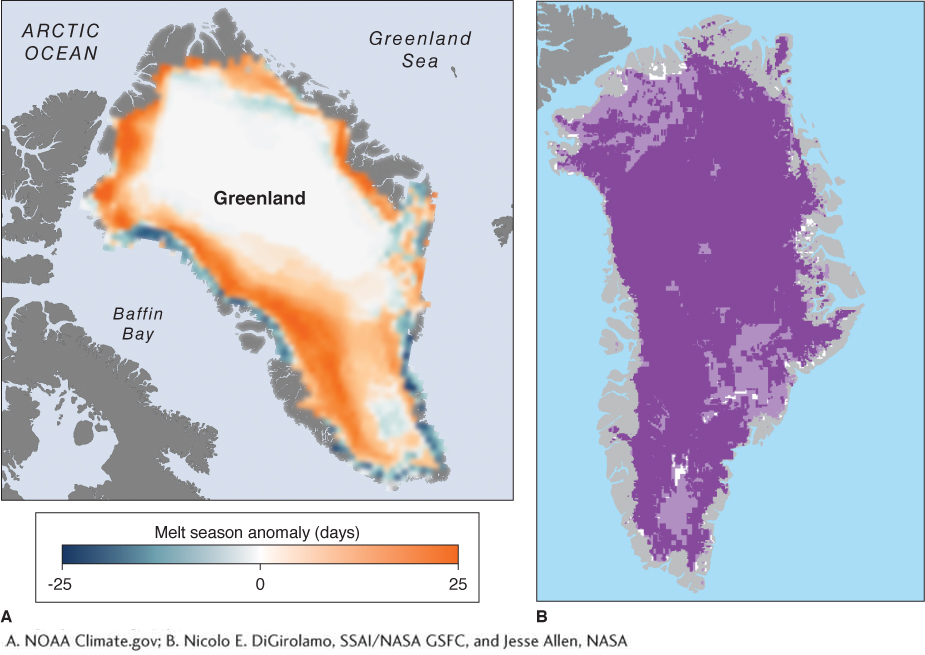
Changes in Greenland snowmelt. (A) The numbers of snowmelt days in 2011 are shown as departures from the 1979–2010 average number of snowmelt days. Orange shows areas with up to 25 days of melt above the average. White shows areas that do not depart from the average. The blue margins of the ice sheet were caused by erroneous satellite readings of bare rock. (B) For the first time, scientists have witnessed melting of nearly the entire surface of the ice sheet. In late July 2012, over a period of 4 days, 97% (shown in the area in purple) of the topmost layer of the Greenland ice sheet briefly melted, then refroze. The ice beneath the surface layer did not melt. Such events are thought to occur only once every 150 years.
(A. NOAA Climate.gov; B. Nicolo E. DiGirolamo, SSAI/NASA GSFC, and Jesse Allen, NASA)