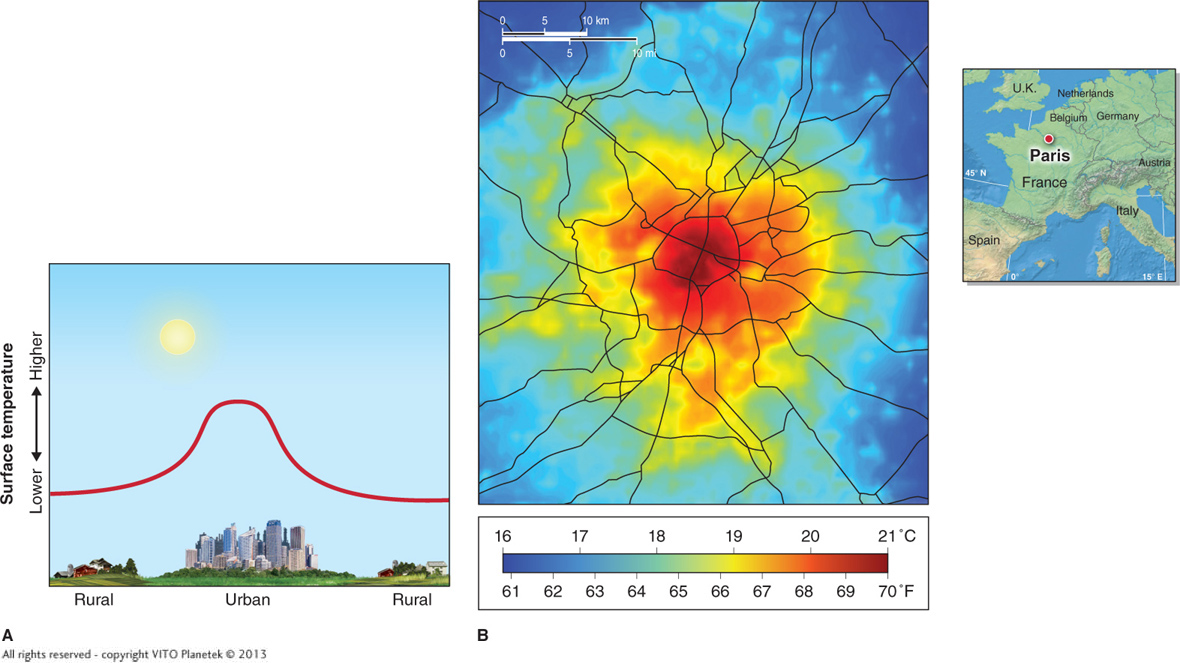
Figure 2.31
Urban heat island. (A) This generalized temperature profile (red line) shows the typical rise in temperature over an urbanized region in contrast to less developed rural areas. The urban heat island effect is most noticeable at night on calm, clear nights. (B) This nighttime thermal infrared map shows the city of Paris, France, during a recor(All rights reserved-