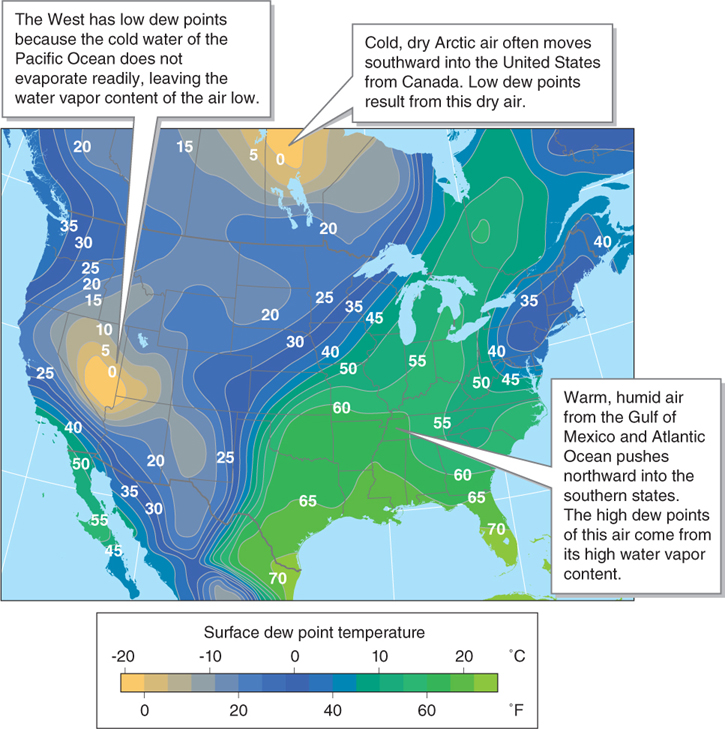
Figure 3.13
North American dew points. This map shows lines of equal dew point in degrees Fahrenheit for May 1, 2013. It represents a common pattern of dew points for the United States and southern Canada for much of the year. The highest dew points are usually in the southeastern United States. The western interior states and provinces have lower dew points because the air is much drier.