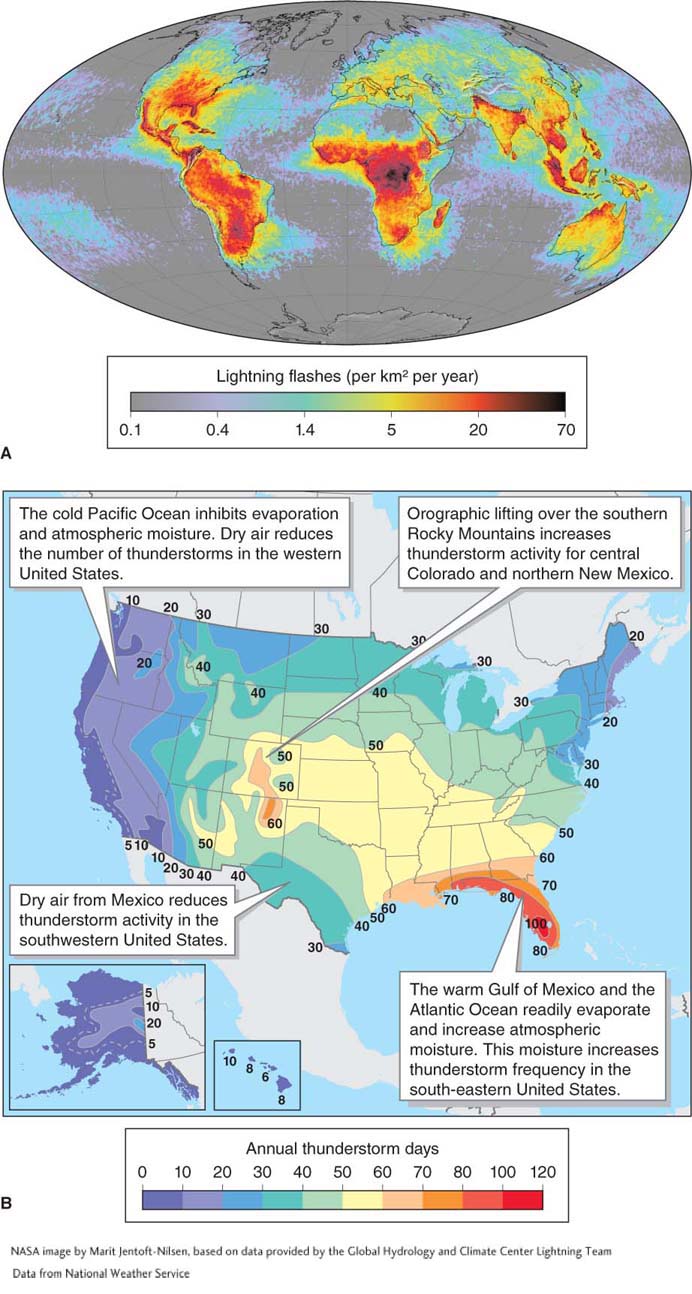
Figure 5.3
Thunderstorm frequency maps. (A) Lightning indicates thunderstorm activity. This lightning-flash frequency map shows the average annual number of lightning flashes for the period 1995–2002. About 70% of all thunderstorms occur over land in the tropics. (B) This map shows the average number of thunderstorm days each year in the United States. On average, more than 80 thunderstorm days occur in the orange and red areas of South Florida.(A. NASA image by Marit Jentoft-Nilsen, based on data provided by the Global Hydrology and Climate Center Lightning Team; B. Data from National Weather Service)