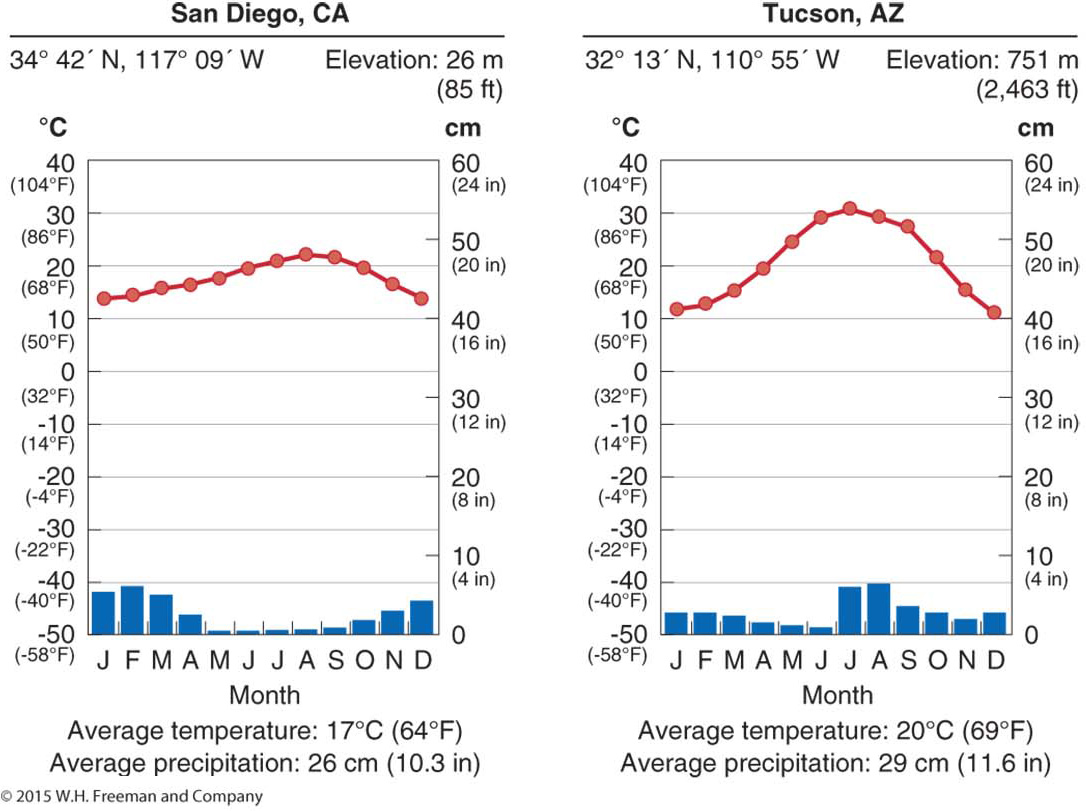
Figure 6.2
Climate diagrams for San Diego and Tucson. Although average annual temperatures and amounts of precipitation for these two cities are similar, the climate diagrams, which show average monthly temperature (red line) and precipitation (blue bars), reveal that their climates are quite different.