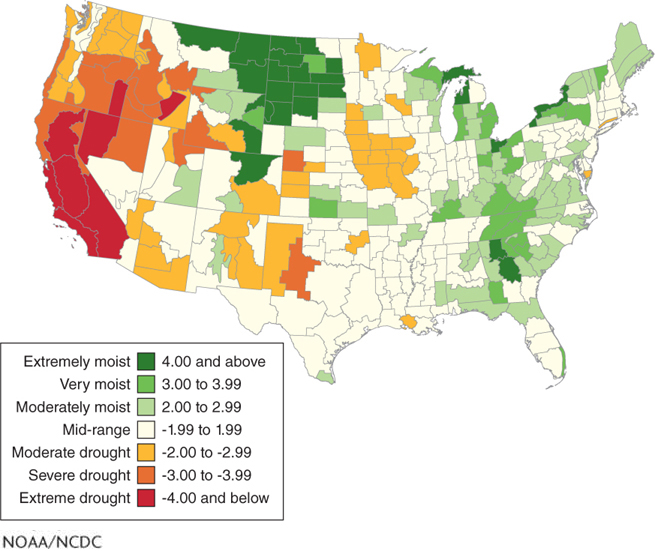
Figure 9.16
Palmer Drought Severity Index. The Palmer Drought Severity Index uses 0 as a normal baseline value. Negative values indicate water deficits; positive values indicate water surpluses. This map shows the Palmer Drought Severity Index for January 2014. At this time, the western United States experienced moderate to extreme drought. For many parts of California, the drought was among the most extreme ever recorded. At the same time, the Dakotas and eastern Montana experienced extremely moist conditions.(NOAA/NCDC)