2.3 Surface Temperature Patterns
Describe Earth’s surface temperature patterns and explain what causes them.
What controls the overall air temperature regime of any given location on Earth? Death Valley, California, is always hot in summer; in fact, it holds the record for the highest air temperature ever officially recorded on Earth: 56°C (134°F) on July 10, 1913, in the shade! Earth’s lowest official air temperature, −89°C (−129°F), was recorded in Vostok Station, Antarctica, at a scientific research base in July 1983. Why is Death Valley so hot? Why is Antarctica so cold?
Recording air temperatures gives us critical data for answering these questions as well as for monitoring climate change. Temperature data are compiled by the Global Historical Climatology Network (GHCN) and are recorded daily at over 75,000 meteorological stations in 180 countries and territories (Figure 2.15). For each station, an average daily temperature is calculated from maximum and minimum daily temperature measurements. Average monthly and average annual temperatures are then derived from these calculations.
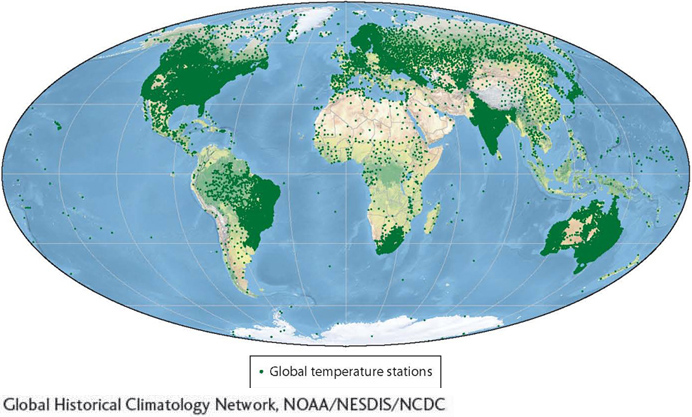
Figure 2.15
The difference between the average maximum and average minimum temperatures over a year at a location is its annual temperature range, or seasonality. Earth’s maximum temperature range (the difference between the highest temperature in Death Valley and the lowest temperature in Antarctica) is therefore 145°C (265°F). In this section we use the average annual temperature and the annual temperature range to explore geographic patterns of temperature.
Average Annual Temperature Patterns
The average annual temperature at any given location is controlled mainly by elevation and latitude. The average annual temperature is lower at higher elevations and higher latitudes.
69
Elevation: Colder in the Mountains
Question 2.10
Does it snow in Hawai’i?
It often snows in Hawai’i at the highest elevations (over 3,000 m or 10,000 ft), where it is always very cold. Hawai’i’s lowest recorded temperature is −11°C (12°F).
The troposphere is heated mostly by Earth’s surface. In the troposphere, temperature decreases with altitude. In Section 1.3, we learned that there is an average environmental lapse rate of 6.5°C per 1,000 m (or 3.6°F per 1,000 ft). Mountains that protrude high into the troposphere are always cooler than surrounding lowland regions. High mountains are often snowcapped in summer, even in tropical locations, such as Hawai’i, where adjacent areas of low elevation are warm. Figure 2.16 illustrates this point with a satellite thermal image.
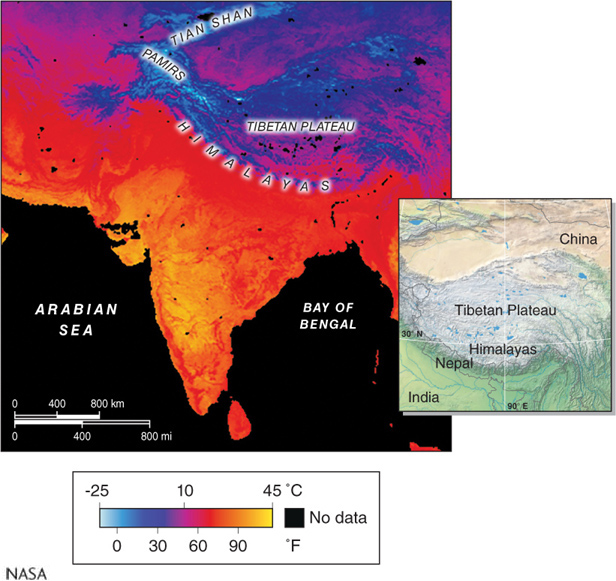
Figure 2.16
Latitude: Colder near the Poles
Because Earth is spherical, temperature generally decreases away from the equator as sunlight becomes more diffuse (see Figure 2.5). Sunlight is increasingly diffuse outside the tropics, resulting in lower surface temperatures at higher latitudes (Figure 2.17).
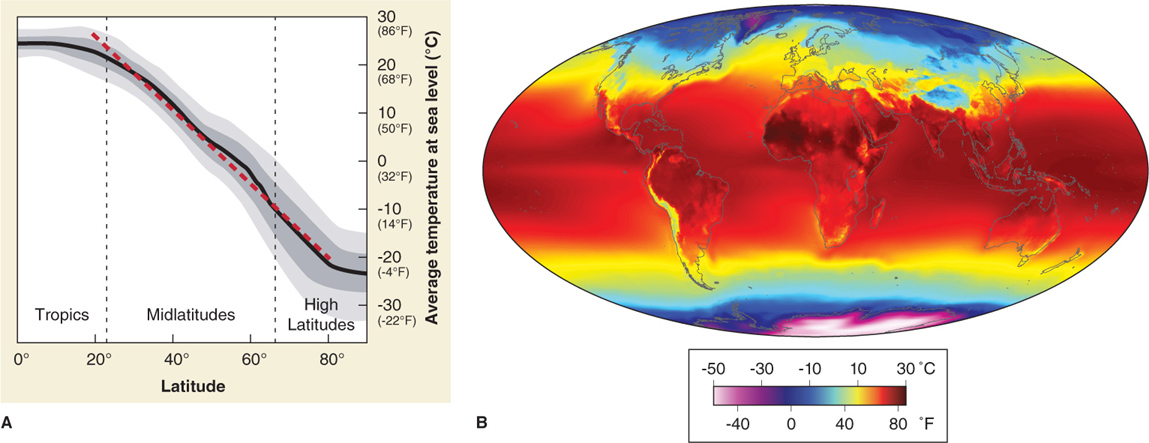
Figure 2.17
Patterns of Seasonality
Imagine you live in a city where the average January temperature is −47°C (−53°F). It is so cold that you must leave your car running all day and all night during the winter months to avoid an engine seized up through freezing. On a cold day, boiling water thrown into the air comes down as ice crystals, and if your house were not heated, there would be no liquid water in it. Food containing water would be frozen solid. Come summer, the average temperature at the same location is roughly 15°C (59°F), and past heat waves have reached the upper thirties (Celsius; nineties Fahrenheit). Such is life for the 1,400 citizens of Verkhoyansk, Russia. The city has an average annual temperature range of 62°C (−47°C to 15°C) or 112°F (−53°F to 59°F).
70
Figure 2.18 gives a quick visual summary of the temperature ranges of two contrasting places, Verkhoyansk (67° north latitude), and Singapore (1° north latitude). The difference in seasonality between Verkhoyansk and Singapore can be explained by two factors: latitude and proximity to the oceans.
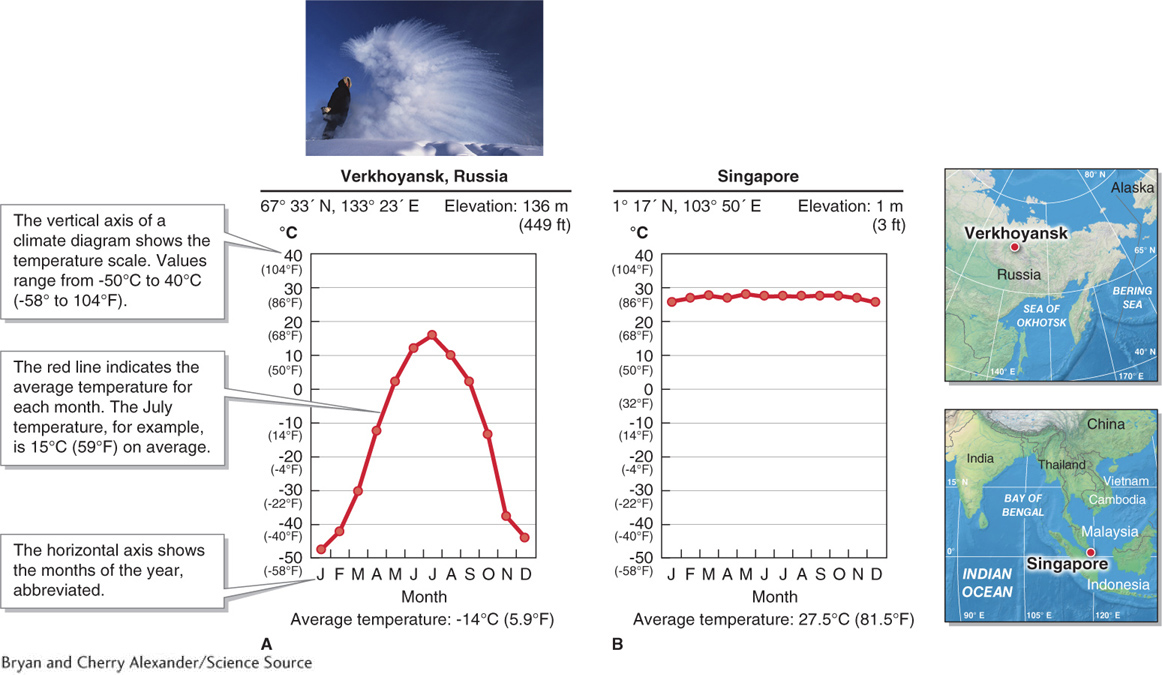
Figure 2.18
As a general rule, high latitudes have a greater annual temperature range than low latitudes. In addition, continental (inland) locations have a greater annual temperature range than maritime (ocean-
continental effect
The increase in seasonality with distance from the oceans.
As a general pattern, locations near the coast have maritime climates, with a relatively low annual temperature range. In contrast, locations far inland have continental climates, with a relatively high annual temperature range. The relationship among latitude, continentality, and annual temperature range is illustrated in Figure 2.19.
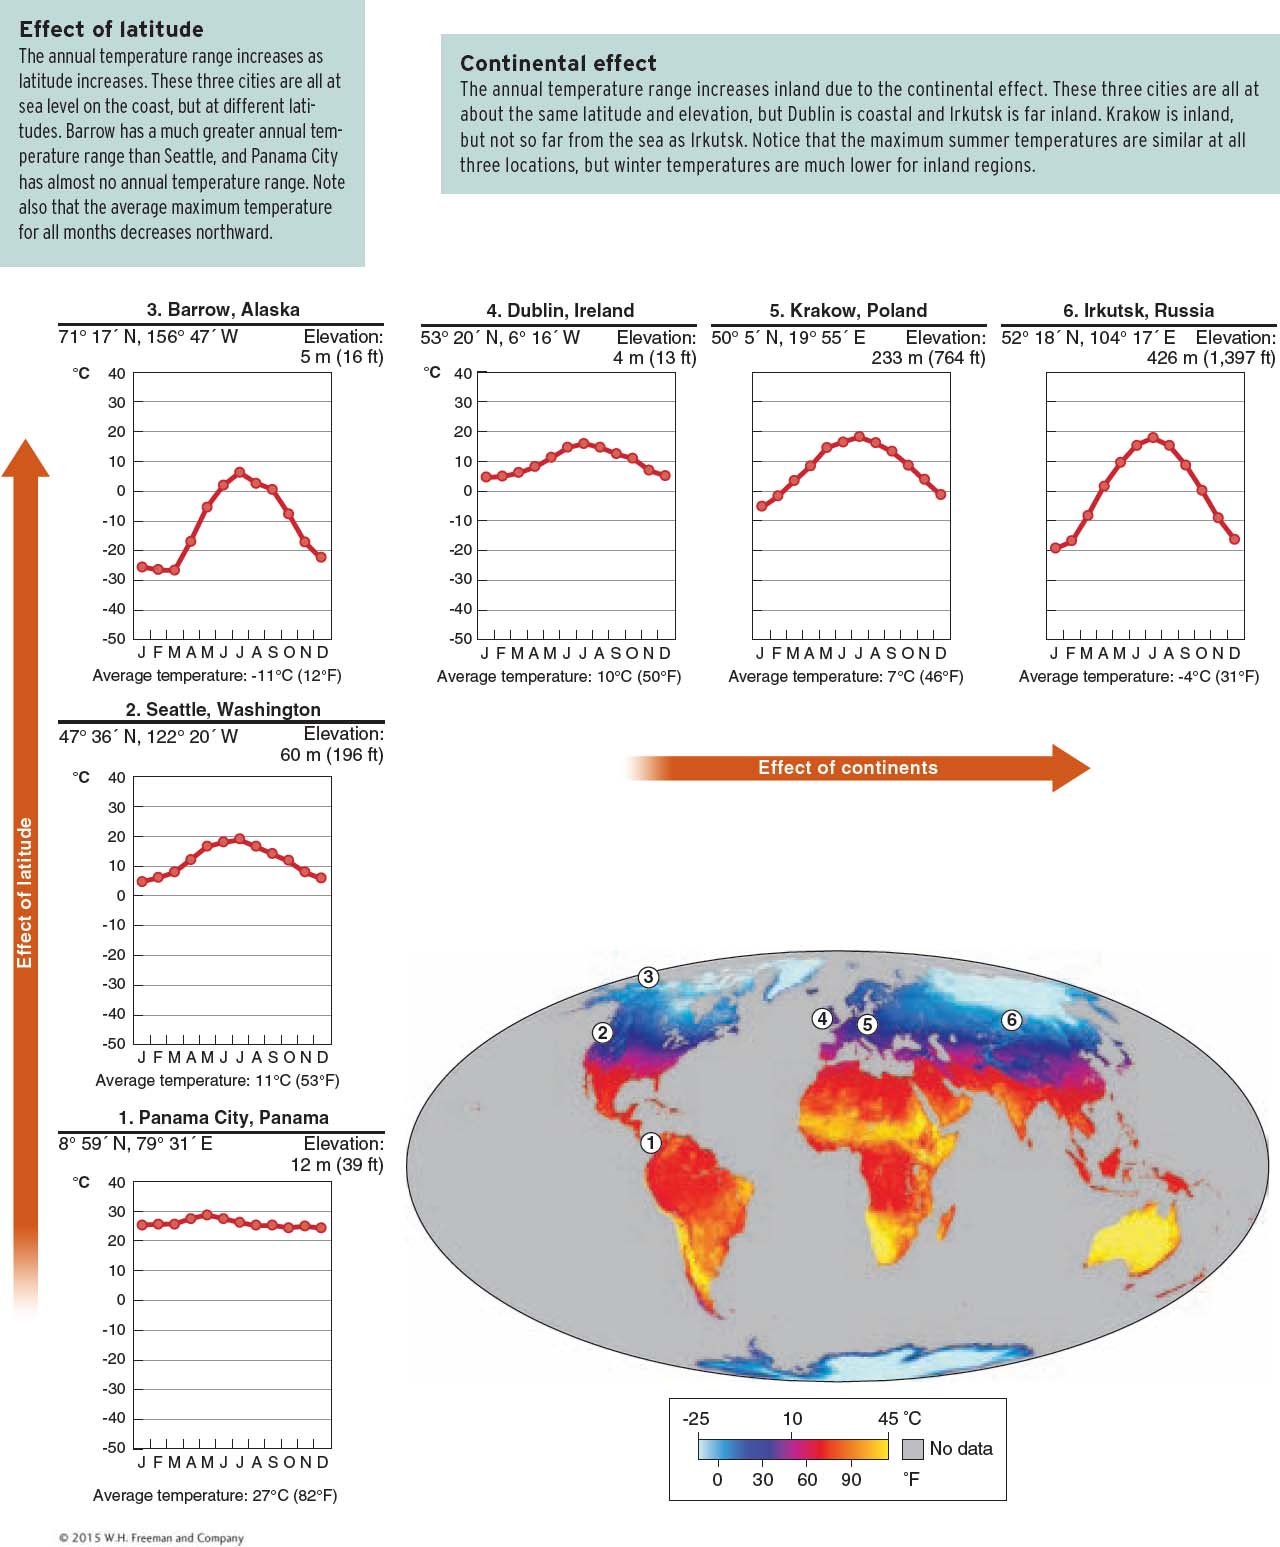
Figure 2.19
What Causes the Continental Effect?
Why do inland regions have greater seasonality than coastal regions? There are four main factors that cause the continental effect: (1) the specific heat of water, (2) the evaporation of water, (3) the mixing of water, and (4) the transparency of water.
You may have noticed at the beach that the sand becomes warm in the afternoon sunlight, but the water does not—
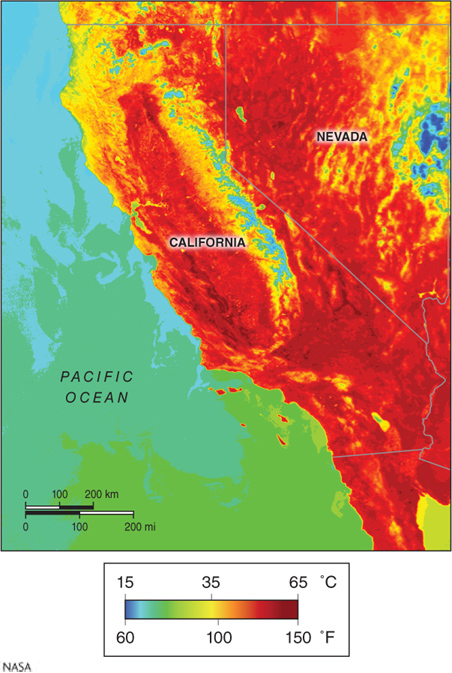
Figure 2.20
71
72
As a general pattern, continents become warmer in summer than oceans at the same latitude. In winter, continents become colder than oceans. Figure 2.21 illustrates this phenomenon using isotherms, lines of equal temperature.
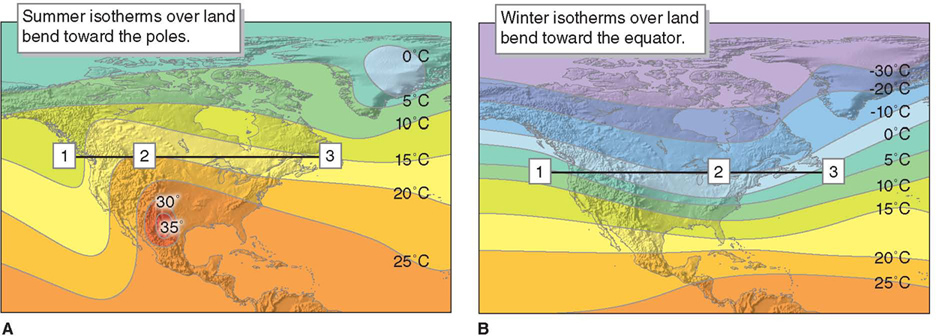
Figure 2.21
The cause of these temperature differences between land and water is the difference in their heat capacities. Heat capacity is the amount of heat that must be absorbed to change the temperature of an object. Specific heat, which is the heat required to raise the temperature of any object or material by a given amount, is a measure of heat capacity. Water’s specific heat is higher than those of most materials that make up landmasses, and the continental effect results mainly from this difference.
specific heat
The heat required to raise the temperature of any object or material by a given amount.
Different materials have different specific heat values, as shown in Table 2.2. For example, it takes 1 calorie of energy to raise the temperature of 1 g of water 1°C. Therefore, water has a specific heat of 1. However, it takes only about one-
Evaporation, water transparency, and water mixing are also important in moderating the temperature of water. Evaporation cools water and prevents it from becoming warmer than it would otherwise become. Because land has relatively little water to evaporate, land heats up more in sunlight than oceans do.
73
|
SUBSTANCE |
SPECIFIC HEAT (Cal/g × °C) |
|---|---|
|
Pure water |
1 |
|
Wet mud |
0.6 |
|
Dry sandy clay |
0.33 |
|
Dry quartz sand |
0.19 |
Transparency is also important. Because water is transparent, sunlight can pass through several hundred meters of water and warm it. Land is opaque, and sunlight does not penetrate it. Similarly, convection mixes the water warmed by sunlight with cooler water at greater depths. Land is rigid and cannot mix, so the land surface heats up faster and to a higher temperature.
Ocean Currents and Seasonality
Warm ocean currents originating in the tropics carry immense amounts of heat toward the poles. When warm ocean currents reach high latitudes, some of their heat is transferred to the atmosphere. A good example of such an ocean-
The Gulf Stream transports more water than all the rivers of the world combined. Some 30 million m3 (1 billion ft3) of water pass by Florida each second. This amount increases to some 150 million m3 (5.3 billion ft3) per second by the time the current reaches Nova Scotia, Canada. As a comparison, the Amazon River, the largest river in the world, has an average flow of about 200,000 m3 (7.1 million ft3) per second.
Warm ocean currents raise the average annual temperature and reduce the annual temperature range. Cold currents influence temperatures less. The Gulf Stream’s effect on annual temperature ranges can be seen when coastal stations at the same latitude are graphed and compared (Figure 2.22).
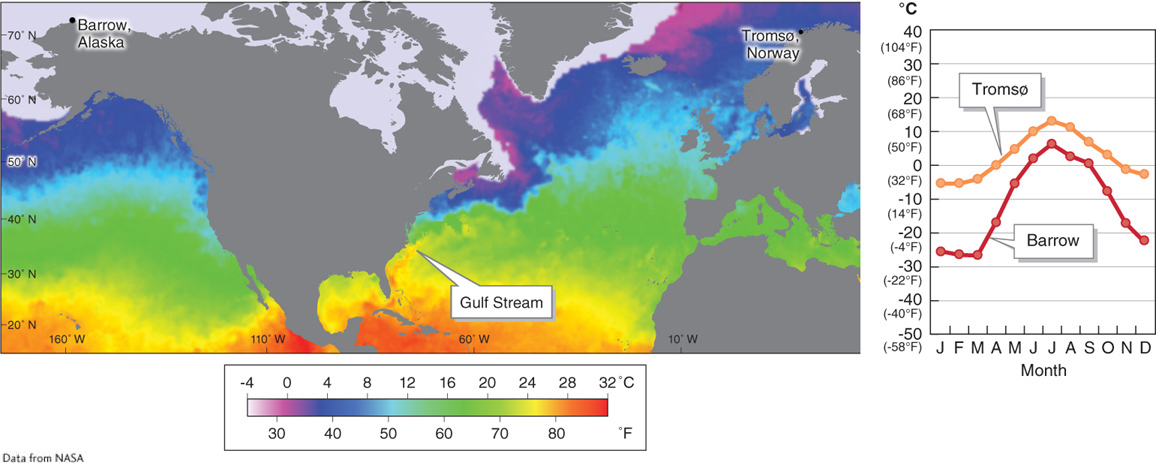
Figure 2.22
Because it transports so much heat, the Gulf Stream has many effects on physical geography, from hurricane formation to the behavior of the global climate system. We will examine the important effects of ocean currents and sea surface temperatures on storms in North America in Section 5.1.
Prevailing Wind and Seasonality
New York, New York, and Crescent City, California, are both coastal cities located at 40° north latitude. We might expect, therefore, that both would have maritime climates, but they do not. Although the average annual temperature for both cities is about 12°C (53°F), these two cities have very different annual temperature ranges. New York, on the east coast, has a continental climate. Crescent City, in California, has a maritime climate. As shown in Figure 2.23, the direction of the prevailing winds causes this pattern.
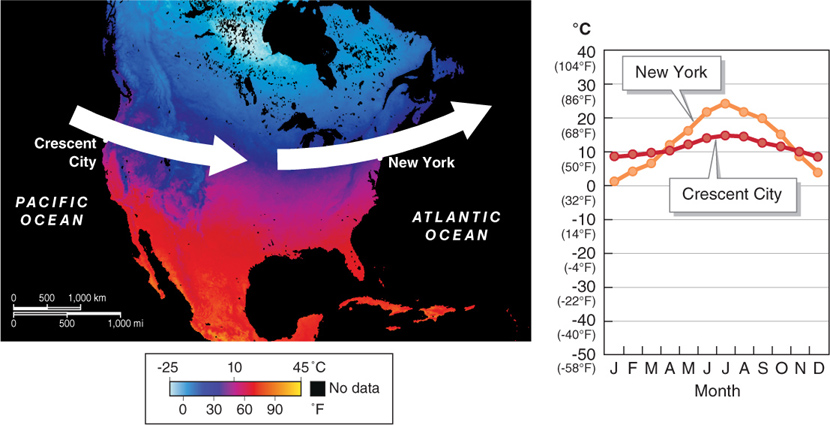
Figure 2.23
74
75
Generally, because the prevailing wind direction is from the west, west coasts have maritime climates and east coasts have continental climates. This pattern is strongest at midlatitudes. It is weakened or nonexistent in the Southern Hemisphere (because landmasses there are small), polar regions (because the water is very cold), and in the tropics (because both land and sea are warm).
Many factors combine to control temperatures at any given location on the planet, but some play a larger role than others, depending on the geographic location. Figure 2.24 shows the global patterns of Earth’s annual temperature ranges and summarizes the main factors determining those patterns.
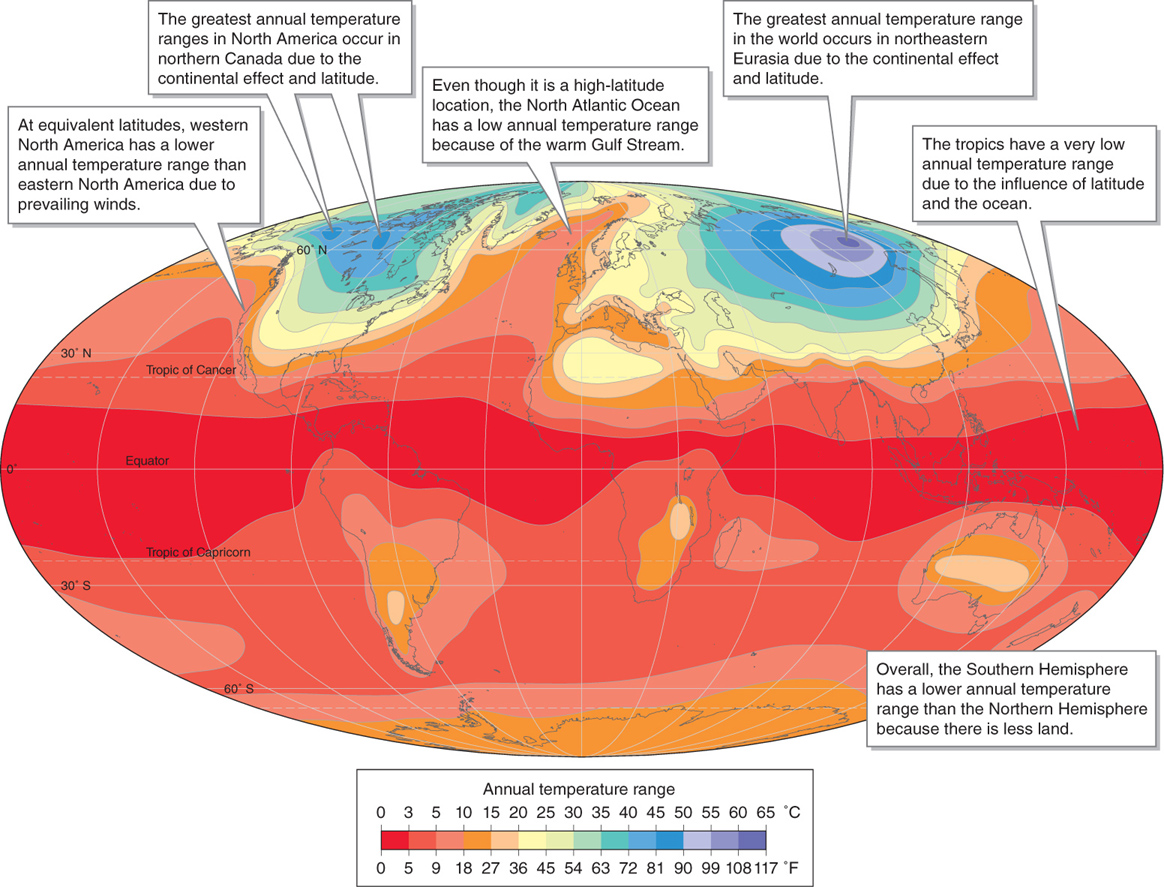
Figure 2.24