4.2 Air Pressure and Wind
Explain how surface air pressure changes and describe three controls on wind speed and direction.
In Section 1.2, we learned that the higher a person travels in elevation, the less atmospheric pressure there is. Mountain climbers refer to pressures below 356 mb (found at about 8,000 m or 26,000 ft elevation) as the “death zone” because oxygen levels are too low for human survival. Barometers are instruments used to measure air pressure. For that reason, air pressure is also called barometric pressure. For extreme mountain climbers, having an accurate barometer can be a matter of life or death. As shown in Figure 4.4, there are two types of barometers: mercury barometers and aneroid barometers.
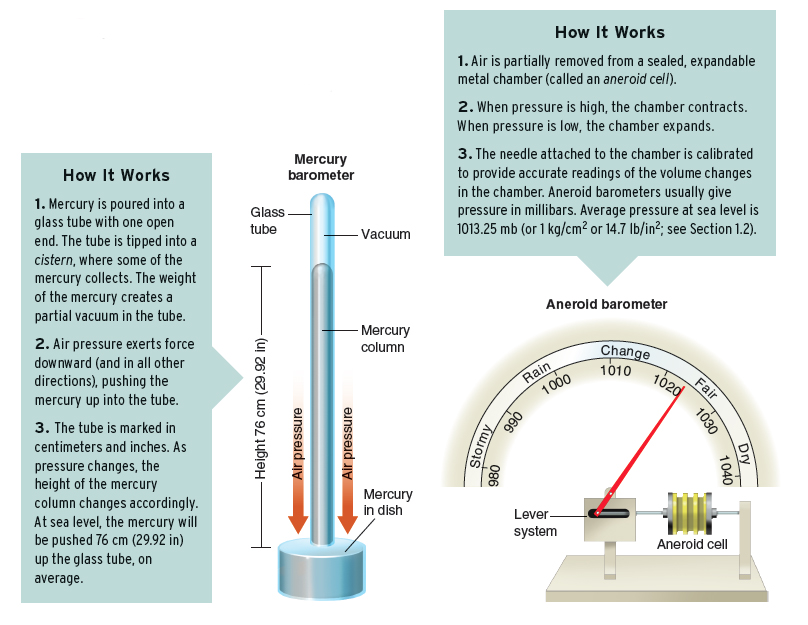
Figure 4.4
barometer
An instrument used to measure air pressure.
In this section, we examine differences in air pressure across geographic space. These horizontal differences in pressure are much more subtle than vertical differences. They are important, however, because even the slightest horizontal differences cause the wind to blow. Meteorologists identify two types of air pressure, categorized by the cause of pressure change: thermal pressure and dynamic pressure.
Thermal Pressure
Thermal pressure is air pressure caused by temperature. Warm air is associated with low pressure, and cold air is associated with high pressure. When the temperature of air is increased, its kinetic energy (rate of molecular movement) increases. Therefore, the air expands, which gives it a lower molecular density and lowers atmospheric pressure. Conversely, when the temperature of air is decreased, molecular movement decreases. As a result, the density of air molecules increases, and so does the air pressure.
thermal pressure
Air pressure resulting from changes in temperature.
130
Air molecules can be compared to a crowd of people standing together. With their arms at their sides, they can stand close together, and many people can fit into a given space (a situation comparable to cool, dense air and thermal high pressure). When the people are active (doing jumping jacks or some other physical movement), they must stand farther apart, and they require more space (a situation comparable to warmer, less dense air and thermal low pressure).
Dynamic Pressure
Dynamic pressure is pressure caused by air movement. The relationship between air temperature and air pressure is not constant because dynamic pressure can override thermal pressure. Air flows in Earth’s atmosphere because of thermal pressure gradients. Yet once the air is set in motion, dynamic pressure changes happen. Where air piles up on itself and compresses, it creates high pressure. Likewise, where airflow accelerates, the air “stretches,” its molecular density decreases, and it creates low pressure. These changes in pressure occur mainly where air flows vertically in the atmosphere, as well as upwind and downwind of mountain ranges.
dynamic pressure
Air pressure caused by air movement.
Wind Speed and Direction
Whether thermal or dynamic, air pressure differences across geographic space drive the wind. But why are some winds hurricane-
Pressure-
When horizontal differences in pressure occur across a region, a pressure-
pressure-gradient force
The force resulting from changes in barometric pressure across Earth’s surface.
Figure 4.5 illustrates the pressure-
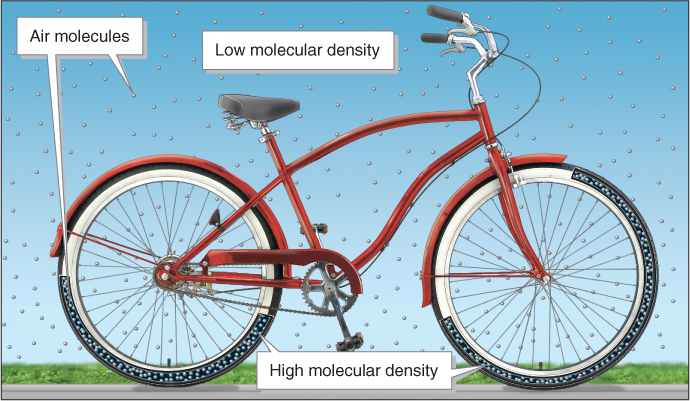
Figure 4.5
Although horizontal pressure changes on Earth’s surface are far more subtle, we can similarly envision the atmosphere’s molecular density as higher in some regions and lower in others (Figure 4.6). As in the bicycle tire, air will flow from regions of relatively high molecular density and high pressure into regions of relatively low molecular density and low pressure. The greater the pressure difference between regions (the steeper the pressure gradient), the faster the air will flow between them. In regions where little pressure change occurs (a shallow pressure gradient), the air will move slowly.
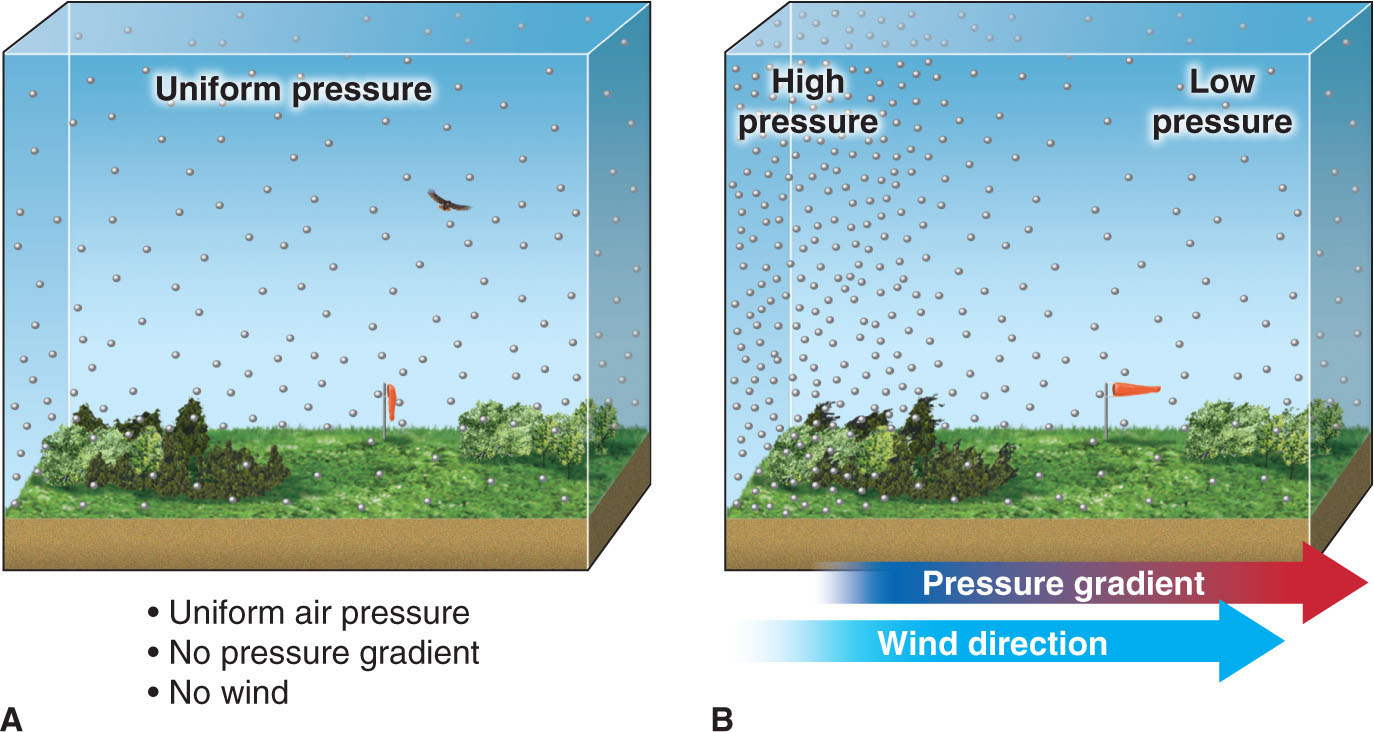
Figure 4.6
131
Visualizing the Pressure Gradient: Isobars
Air pressure decreases rapidly as elevation increases. Near Earth’s surface, it drops about 10 mb with each 100 m increase in elevation. Meteorologists must adjust for elevation differences when comparing surface pressures between geographic regions. Station pressure is barometric pressure that has not been adjusted to sea level. Sea-
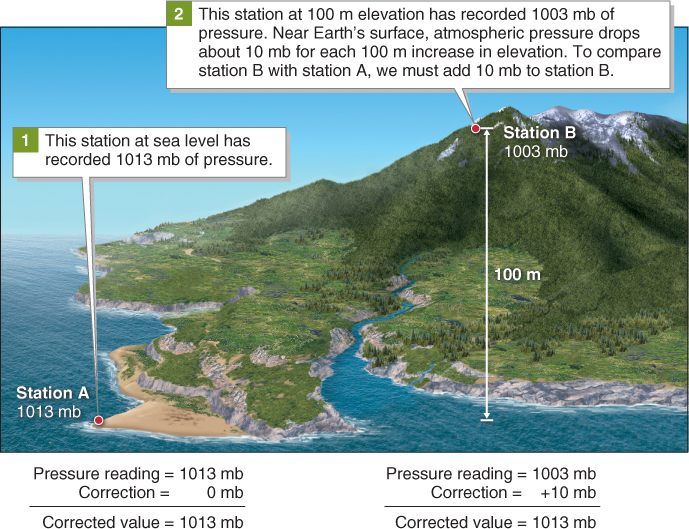
Figure 4.7
sea-level pressure
Air pressure that has been adjusted to sea level.
Once station pressure readings have been converted to sea-
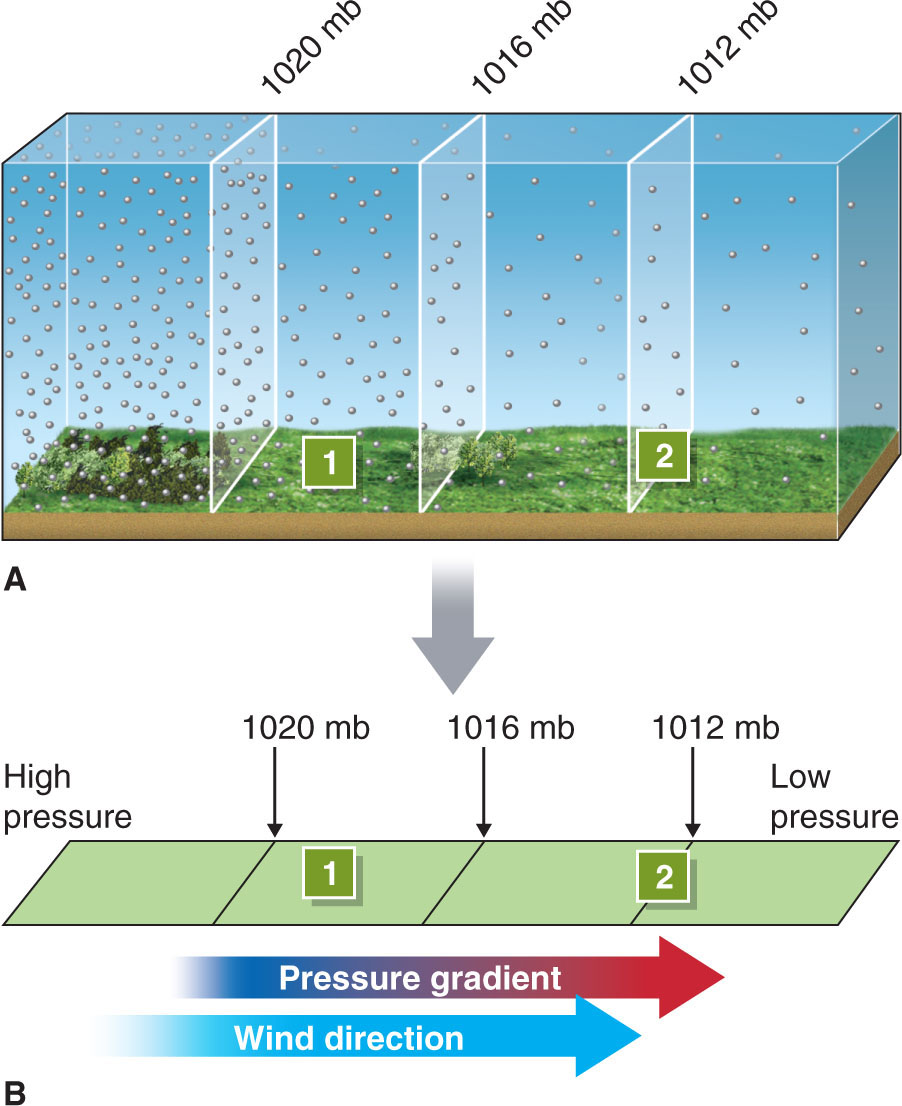
Figure 4.8
isobar
A line drawn on a map connecting points of equal pressure. Isobars are quantitative representations of the changing molecular density of the air over a geographic region.
CRUNCH THE NUMBERS: Calculate Denver’s Station Pressure
CRUNCH THE NUMBERS: Calculate Denver’s Station Pressure
Question 4.1
jMenESUKYqS/4tkR7fqEZe7k5iTzO170rjJKixeZ7/GnIV4/SRdRIIrhUk7A59HRbwtHLbby9nuuAQS0rhg4p8ICK11FdqGu4Lftk6BW8he1oGexyANhDCibIRz2b2FKC3AvSyTwz1LHvxm/FZsbtiTKkLP+GZta8nkfAjMs7jEB0tmWoxFZfNhEjKjNqlwBVXcUHoHBrsqMjYdU2NzwbTWuuBlGFG/fWYElqaow3YHih6SzyRMpDzuTHpPU7vN4ja/k/JtBX5nB8FGG5lPaA5kVradKIo3uxF5FelDNd7pVZAJM+kgOU39y7IYj0+kHuhTbcsfRj9jz5JPUODYUwKLpp9nnjIlju9HVDYl8P5QdCSbDhz31qAxjOfgAvsoksQg4s/X3SppZGXu+HLgGZEzfGU3jg3JzeC77547QninwOODbJJN4XckmI0UWEHYjPq9xy8ljHL3m1xq2qSgn2szAOr44kqLlcK6I7EMRHC9OCx37xFidPi0JIEZdJGqn3G9oIqTJM3An3fGn338sG59gCQ7FGhYg0QdCbxhzO2NziLbM9RS3U4+XJjCd4AcEKhBYpcYSY4PYk7TJWfqWqAry4d5gIxbYN+w1glUVwcuDxyD+KPo4/agryTZqIoprhMD4r8EobrzF7KRUGmj4q2KlYqWGlqDPZGelcsSzR2LVyxwdZEcsxRsbO0/QSg1L132
Isobars are the most important means of mapping horizontal pressure differences in Earth’s atmosphere. There are two key points to remember about isobars (Figure 4.9): (1) The pressure gradient runs perpendicular (90 degrees) to isobars. (2) Where isobars are close together, the wind blows fast because the pressure gradient is steep. Where isobars are far apart, there is little or no wind because the pressure gradient is shallow.
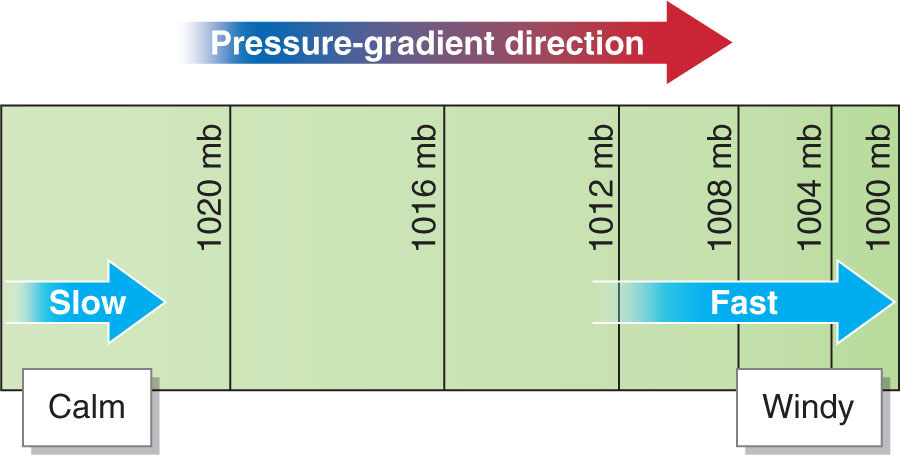
Figure 4.9
Coriolis Force
Earth’s rotation creates Coriolis force, which causes objects that travel great distances to follow curved paths rather than straight lines.
 Animation
Coriolis force
http:/
133
Coriolis force (or Coriolis effect) is the perceived deflection of moving objects in relation to Earth’s surface. This deflecting effect is named after the French scientist Gaspard-
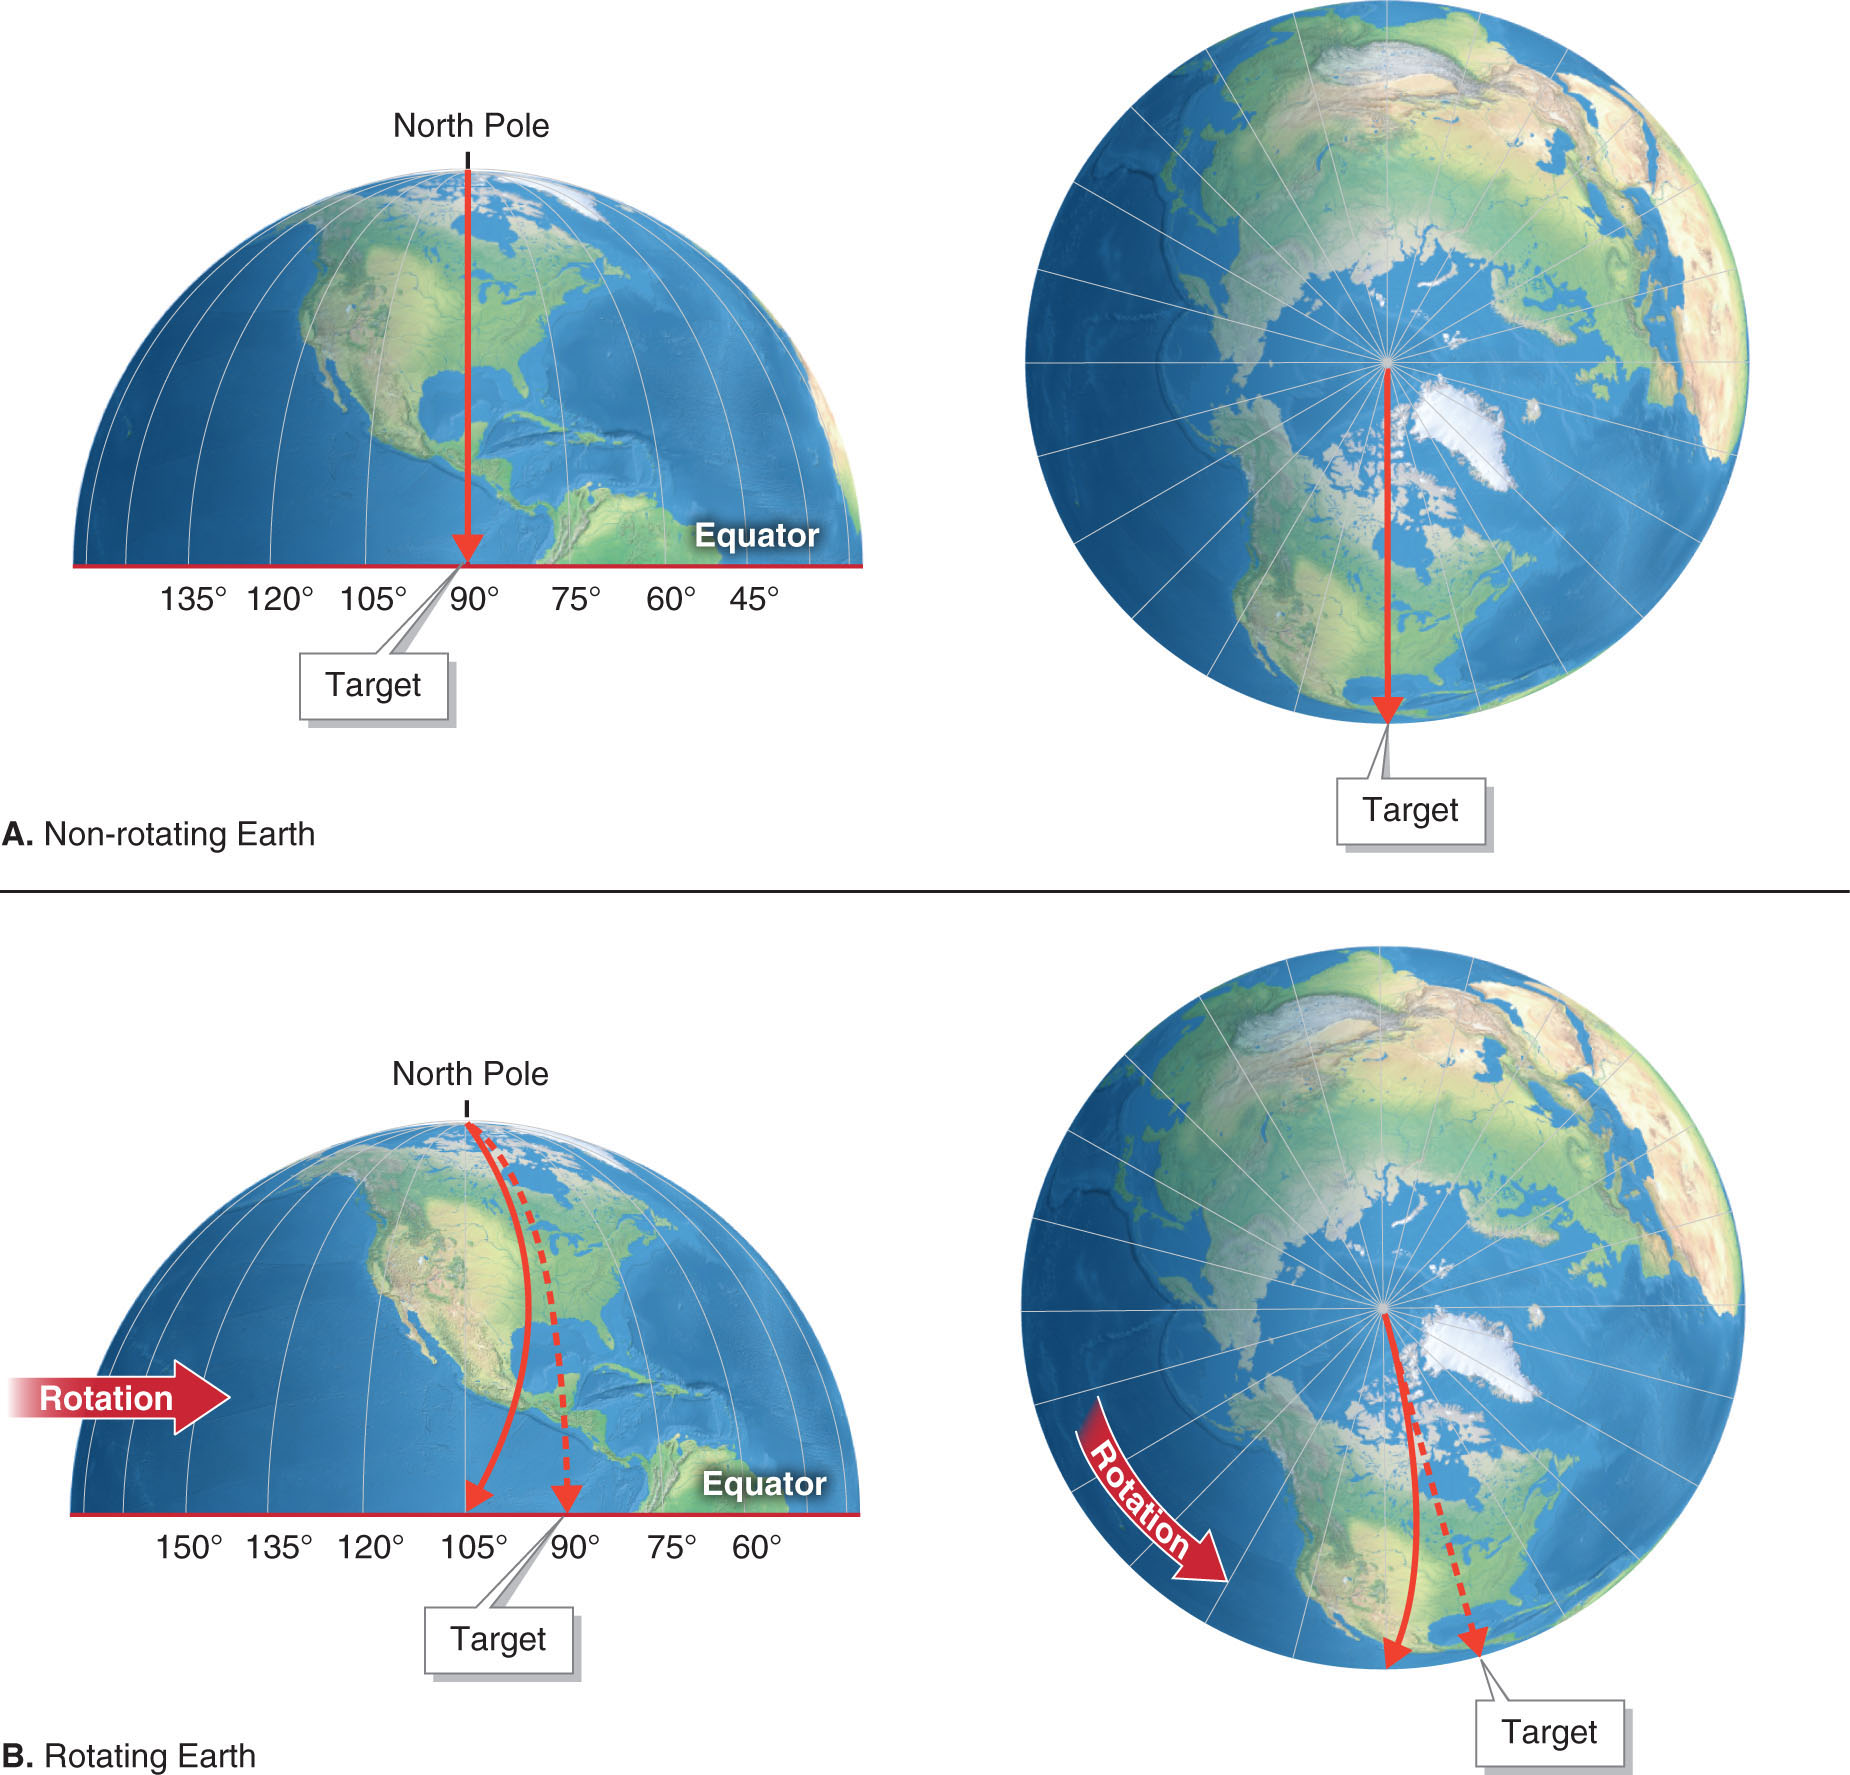
Figure 4.10
Coriolis force
(or Coriolis effect) The perceived deflection of moving objects in relation to Earth’s surface.
In the Northern Hemisphere, moving objects veer to the right because of Coriolis force. In the Southern Hemisphere, they veer to the left. The direction of travel does not affect the direction of deflection. Coriolis force is greatest at high latitudes, less at middle latitudes, and absent within about 5° north and south of the equator. Figure 4.11 illustrates the effect of Coriolis force on wind direction in relation to isobars.
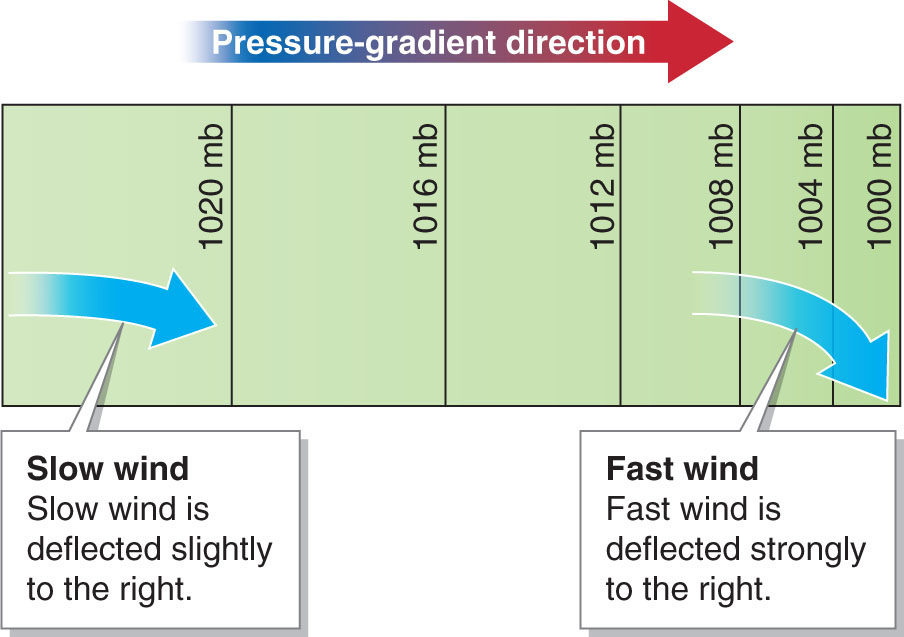
Figure 4.11
Question 4.2
Does Earth’s rotation control the direction in which water spirals down a drain?
No, the distance within a sink is too short for Coriolis force to influence the water’s direction of flow. The direction in which water spirals down a drain is determined by movement in the water and the shape of the sink basin.
Large geographic distances are required for Coriolis force to have a significant effect. So water spiraling down the drain in a sink is not deflected by Coriolis force, because the distance of only centimeters is insufficient for deflection to occur.
Friction Force
As air flows down a pressure gradient, it is slowed by frictional drag near Earth’s uneven surface. As friction slows the wind, Coriolis force deflects the wind less. Mountains, forests, buildings, and even ocean waves all slow the wind.
The boundary layer—the area of the atmosphere where wind is slowed by friction with Earth’s surface—
boundary layer
The layer of the atmosphere where wind is slowed by friction with Earth’s surface; extends about 1 km (3,280 ft) above the surface.
Cyclones and Anticyclones
Together, the three controls on wind speed and direction—
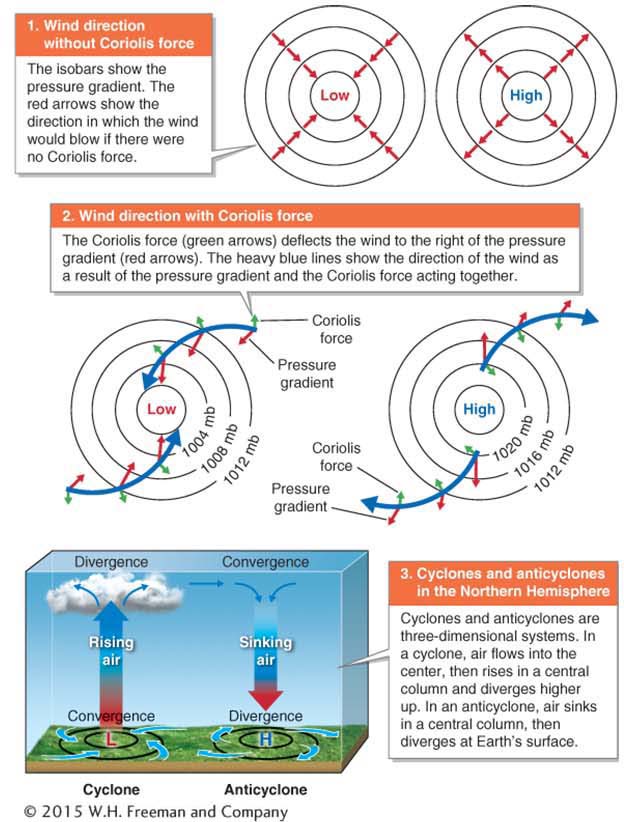
Figure 4.12
cyclone
A meteorological system in which air flows toward a low-
anticyclone
A meteorological system in which air flows away from a high-
134
Cyclones are particularly important meteorological systems because most storms are cyclonic systems and they are sometimes destructive (Figure 4.13). Storms are covered in greater detail in Chapter 5.
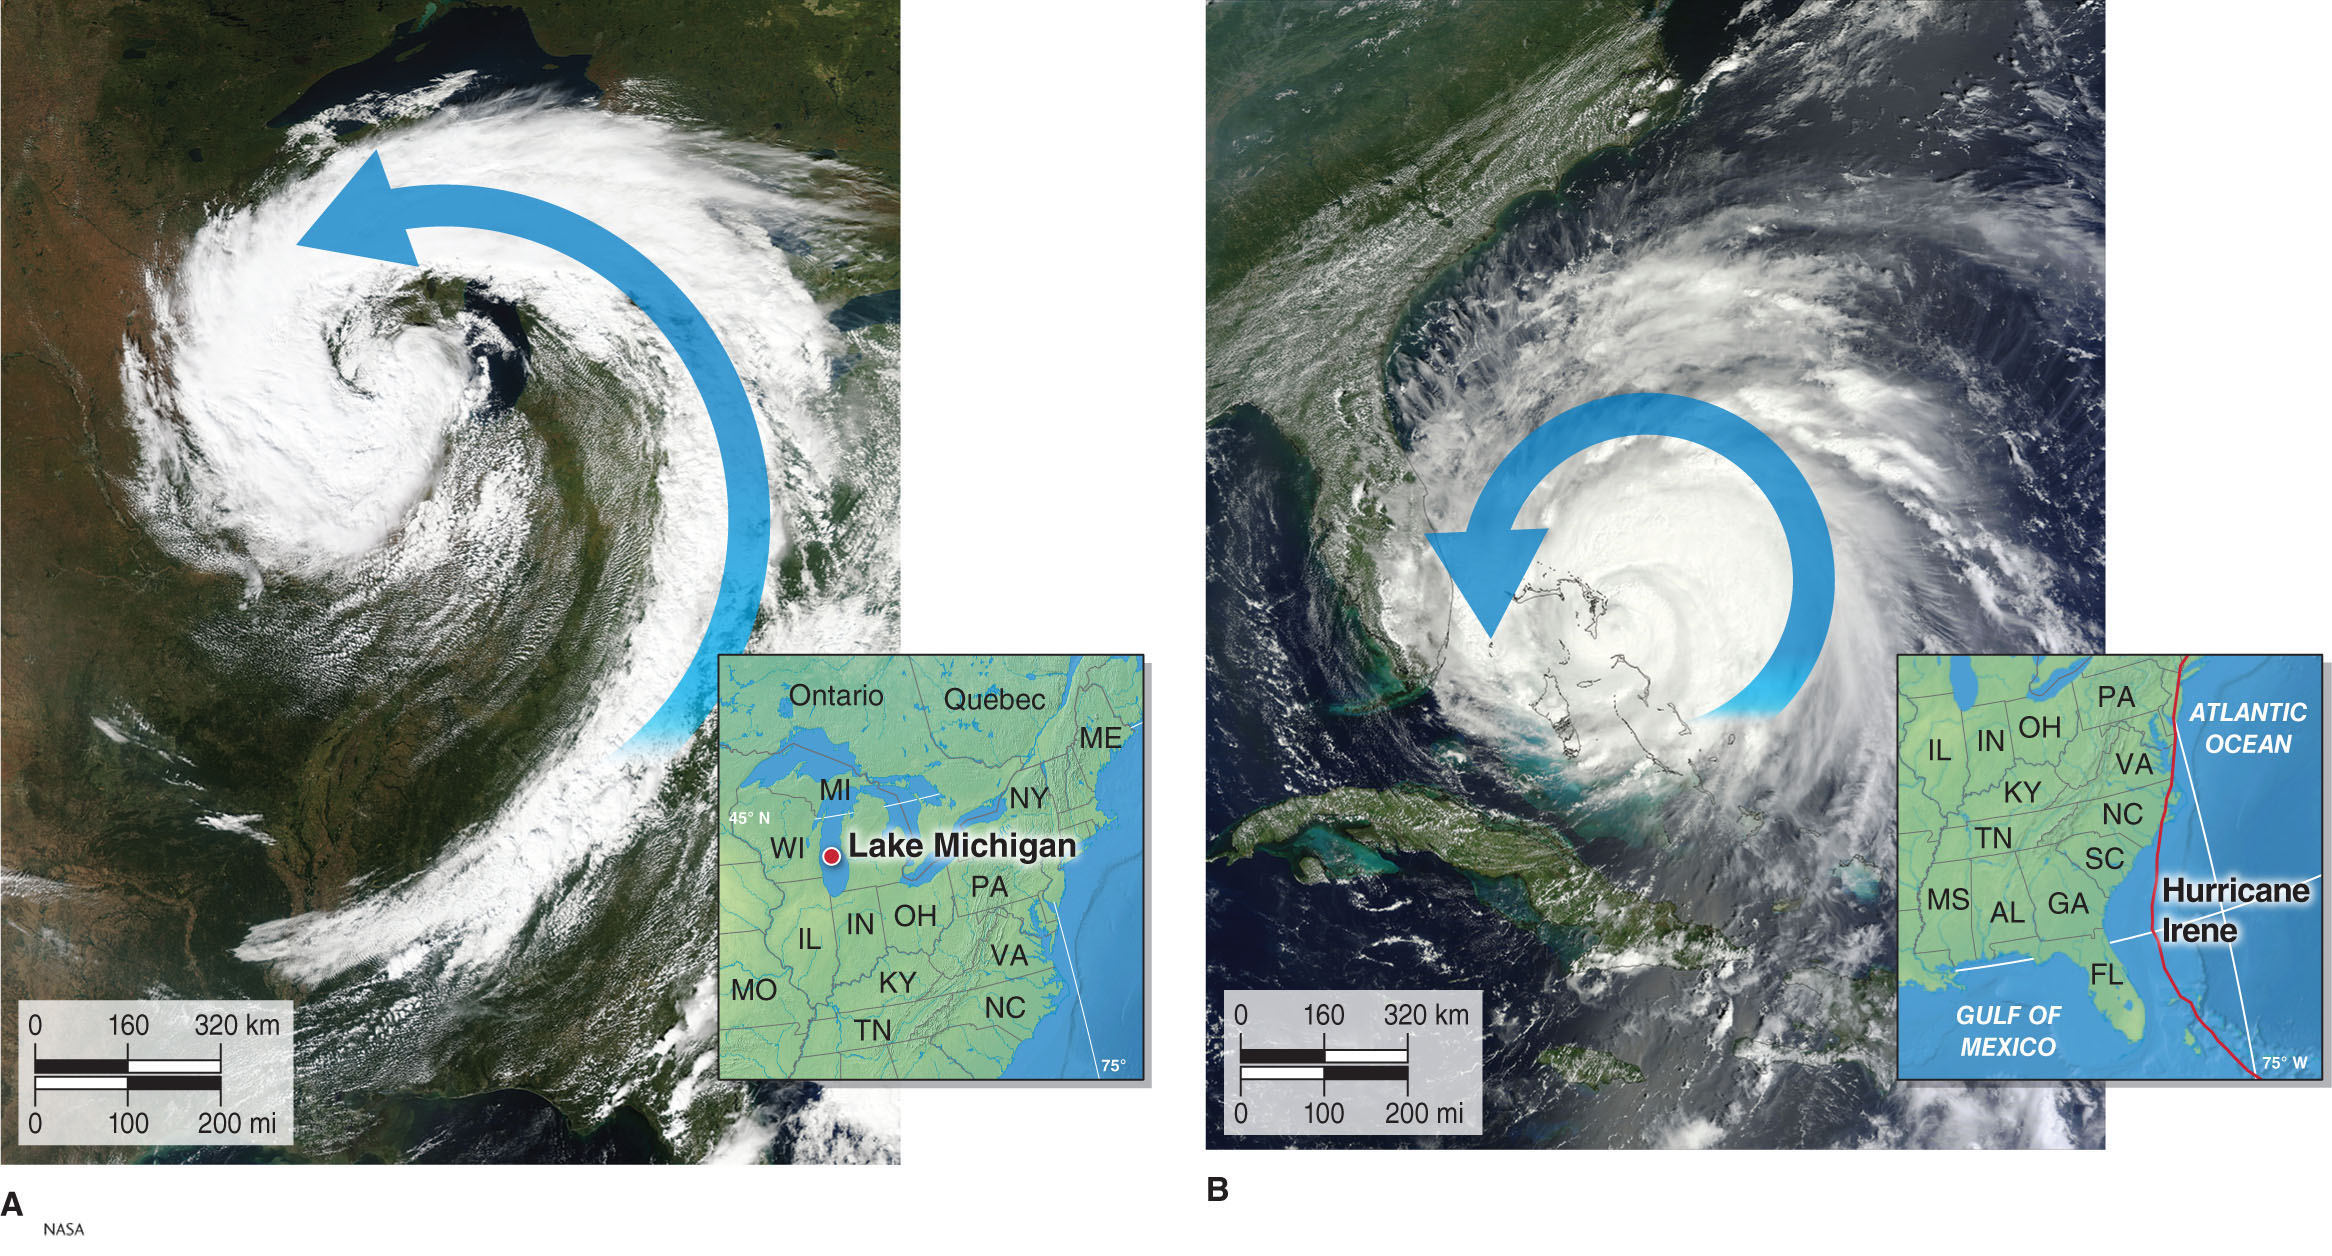
Figure 4.13