5.6 Are Atlantic Hurricanes a Growing Threat?

Assess the current and potential vulnerability of the United States to major hurricanes.
The vulnerability of the United States to hurricanes was made clear in 2005, when Hurricane Katrina struck and flooded New Orleans. Because of natural settling and compaction of the sediments on which New Orleans was built, much of the city is slowly sinking and is now below sea level. Three hundred and fifty miles of seawalls and river levees are all that keep the ocean and the Mississippi River out of the city.
The 6 m (20 ft) storm surge generated by Hurricane Katrina caused many of the levees protecting New Orleans to be overtopped by water or collapse as water flowed under them. Within hours, 80% of New Orleans was under water, in some places 25 feet deep. The cost was more than 1,800 human lives and some $128 billion in structural damage. More recently, in 2012, Superstorm Sandy, in which a hurricane combined with a nor’easter, inflicted significant damage in the New Jersey and New York coastal areas (Figure 5.28).
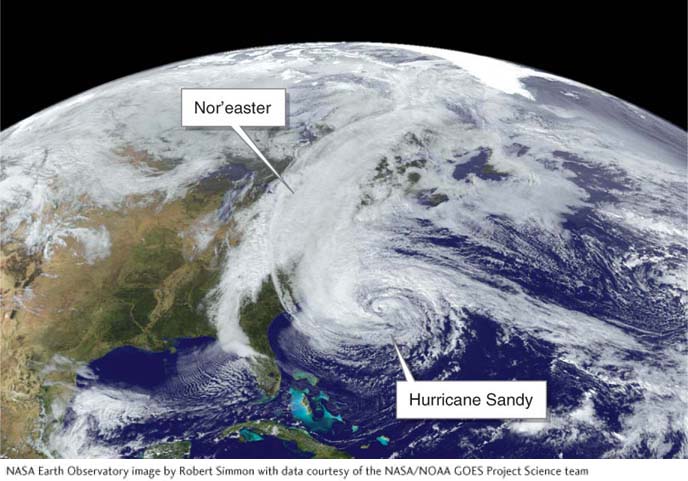
Figure 5.28
Hurricane Activity
About 300 hurricanes have struck the United States since record keeping began, and more than 100 have struck since 1950. Almost all coastal regions in the Gulf of Mexico, in the southeastern United States, and up the eastern coast of North America have been struck by hurricanes (Figure 5.29).
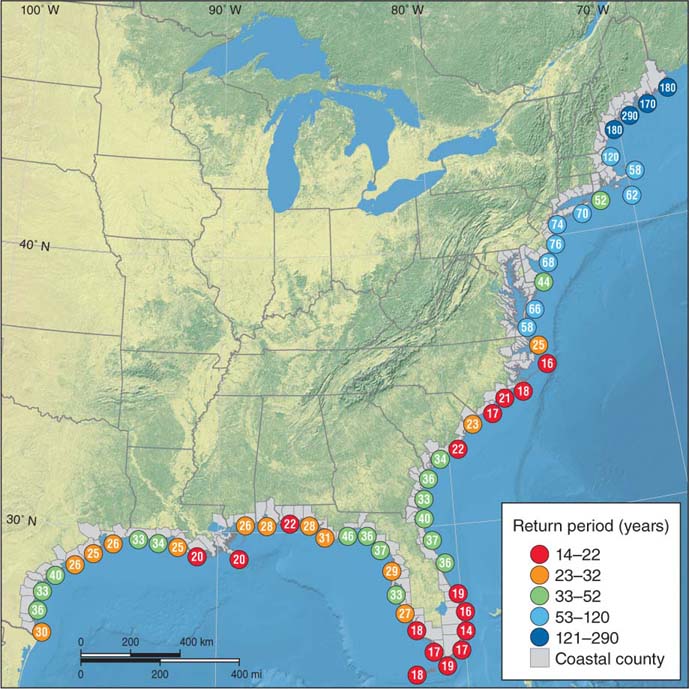
Figure 5.29
Except for New Orleans, Miami is the largest metropolitan region in the United States most at risk of flooding and wind damage by a major hurricane. The last time Miami was struck by a hurricane was in 1950, when Hurricane King made a direct hit on downtown. In all, King caused 3 deaths and about 50 injuries. Although damage was considerable, there was little loss of life because fewer than half a million people lived in the Miami metropolitan region at the time. Miami has not suffered a direct strike by a hurricane since, although Hurricane Andrew struck Homestead, a southern suburb, in 1992.
184
Since 1950, however, the population of South Florida has grown significantly, and it is projected to be one of the fastest-
Climate Change and Hurricanes
Atmospheric warming has caused a sea-
There is a natural cyclical pattern of hurricane activity. The 1950s and 1960s was an active period for hurricanes. In the 1970s and 1980s, hurricane activity decreased. Then, in the 1990s, it began to increase again, as shown in Figure 5.30.
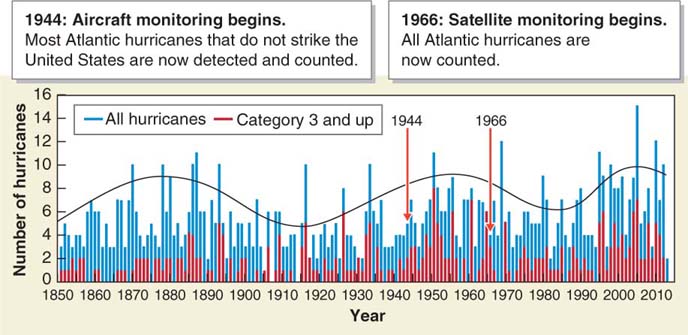
Figure 5.30
Taken as a whole, there has been little to no change in the average number or strength of Atlantic hurricanes during the past century. The atmosphere’s temperature began increasing about 100 years ago, but long-
Earth’s climate is exceedingly complex. There are many factors besides the temperature of the oceans and atmosphere that influence hurricane activity. El Niño, for example, decreases the number of Atlantic hurricanes by causing increased wind shear, which tears hurricanes apart. La Niña, on the other hand, favors Atlantic hurricane development. Similarly, a 2011 study published in the journal Science finds that that wind and wave heights over the oceans have increased by up to 7% in the last two decades worldwide. Windiness and associated wind shear may suppress hurricane formation. Because of these and other complicating factors, scientists are uncertain how climate change will influence hurricanes in the coming decades.
185