CHAPTER 6 Picture This. Your Turn
CHAPTER 6 Picture This. Your Turn
Picture This. YOUR TURN: Annual Carbon Dioxide Increase
Picture This. YOUR TURN
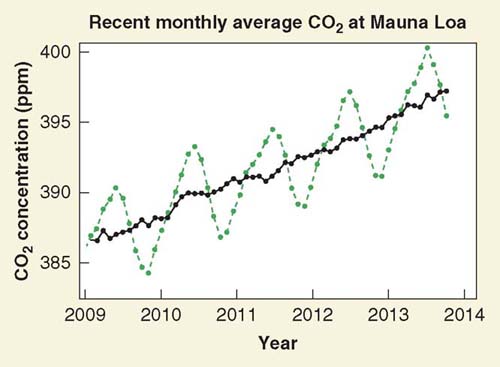
Annual Carbon Dioxide Increase
The graph shows atmospheric concentrations of CO2 measured at the Mauna Loa Observatory. The green line shows seasonal variation around the annual average (black line). Use what you have learned in this chapter to answer the following questions.
Question 6.74
VZCcVEAiLDxCptlfrHt2C0ilkPzSS96xxTdc+0z3BmEUd+k8s4/IF8tQnLcWWYmLz1Krv5+/RCiyalzU3ah1mjYkIuRpUjj9LP6c6zakaU7kziV1EOqh9g==Question 6.75
6Oy3bQFKM2jxtJ6ECSUpQ8hV7a/L2fa5Ltrix/YsyEMZ8ye7Z3fNAFwkD6bilXsJXjPoPOiytUnXh2BFXLQTML9gLDFeCW3tq7iD4p7Ci1Vmt45IEhllXTon+r13lyPge5+jSWFzV30axsYgfvxi10+57RN+JVImAFC3pw==
CHAPTER 6 Further Reading
CHAPTER 6 Further Reading
Diamond, Jared. Collapse: How Societies Choose to Fail or Succeed. New York: Viking Press, 2005.
Riser, Stephen, and M. Susan Lozier. “Rethinking the Gulf Stream.” Scientific American 308 (February 2013): 50–
55. Zachos, James, et al. “Trends, Rhythms, and Aberrations in Global Climate 65 Ma to Present.” Science 292 (2001): 886–
993.