6.2 Trends, Cycles, and Anomalies
Discuss the reasons why climate changes and list the factors that cause it to change.
Throughout geologic time, Earth’s climate has always changed. The climate that we are experiencing today has been around for only about 10,000 years, a mere snapshot in Earth’s history. Earth has experienced climates so cold that nearly the entire planet was covered in ice and snow, as well as climates so warm that there was no polar ice. Earth’s climate history can be reduced to three natural modes of change: long-
Climate Trends: A Long, Slow Cooling
The Cenozoic era began 66 million years ago. Early in that era, about 55 million years ago, the average global temperature was about 12°C (22°F) warmer than it is today. There was no ice at either of the poles. Atmospheric CO2 concentrations were above 1,000 ppm, far higher than the present concentration of roughly 400 ppm (see Section 1.1). About 55 million years ago, a long, slow cooling trend began (Figure 6.3).
Cenozoic era
The last 66 million years of Earth history, marked by a persistent global cooling trend that began about 55 million years ago.
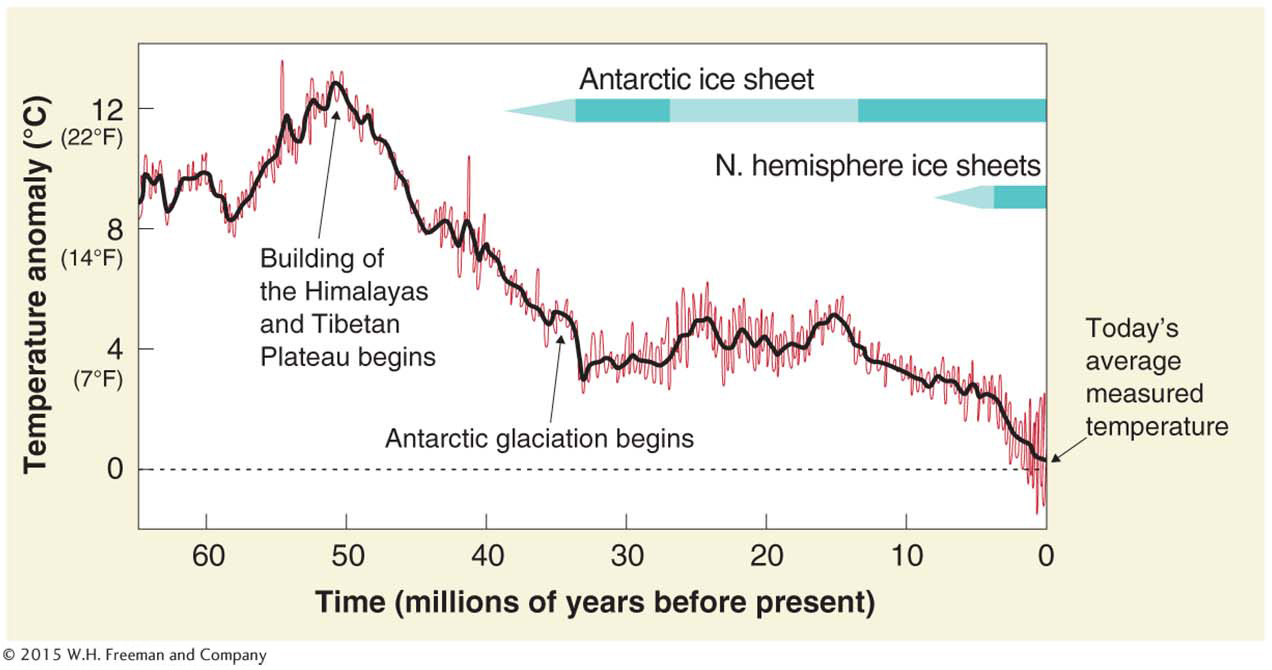
Figure 6.3
The building and uplift of the Tibetan Plateau and the Himalayas are the leading explanation for the Cenozoic cooling trend. Gradual weathering and erosion of the uplifting mountain range caused CO2 in the atmosphere to bond with other minerals that became dissolved in rivers. These minerals were then stored away as sediments and rocks on the ocean floor. As CO2 was drawn out of the atmosphere and transferred to the lithosphere, a persistent cooling trend developed.
Climate Cycles: A Climate Roller Coaster
During the ice age of the last 2.6 million years, which geologists call the Quaternary period, the climate has experienced a series of swings like a roller coaster, cycling back and forth between cold glacial periods and warm interglacial periods some 22 times.
Quaternary period
The last 2.6 million years of Earth history; an ice age.
Glacial and Interglacial Periods
A glacial period (or glacial) is an interval of cold climate within the Quaternary ice age. An interglacial period (or interglacial) is an interval of warm climate that occurs between glacial periods. Between about 2.6 million and 1 million years ago, swings between warm and cool climates occurred on a 41,000-
glacial period
A cold interval within the Quaternary ice age.
interglacial period
A warm interval that occurs between glacial periods.
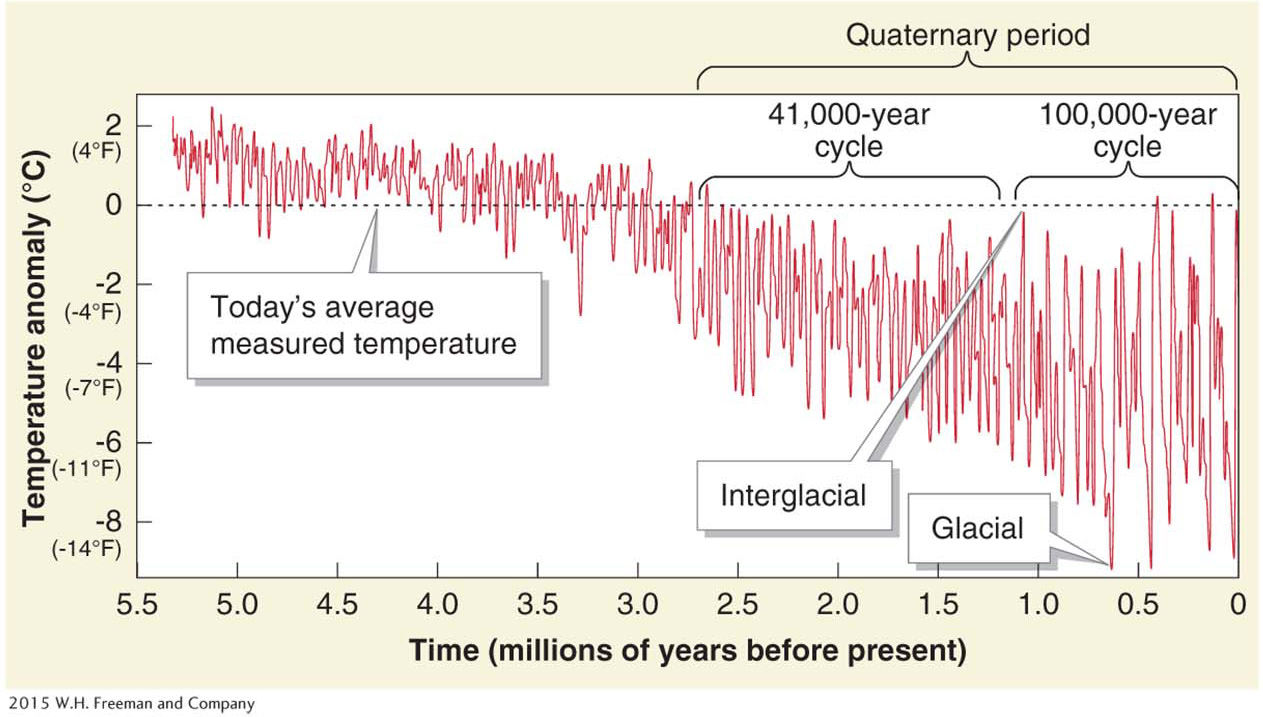
Figure 6.4
197
We are currently in an interglacial called the Holocene epoch (or the Holocene). The Holocene, which began 11,700 years ago and continues today, is Earth’s most recent interglacial. Within the Quaternary as a whole, the Holocene has been a period of unusually stable climate. Given that the average length of warm periods over the past million years is roughly 10,000 years, we are nearing the end of the Holocene. Following this same cyclical pattern, in the next few thousand years Earth’s climate should enter a glacial cooling trend that will last some 90,000 years.
Holocene epoch
The current interglacial period of warm and stable climate; the last 10,000 years of Earth history.
Why has climate cycled back and forth between warm interglacials and cold glacials about 22 times during the last 2.6 million years? The first person to contribute to our understanding of this phenomenon was the largely self-
Milankovitch Cycles
Milankovitch identified three periodic changes in Earth’s orbital relationship to the Sun that led to changes in the timing and distribution of solar heating across Earth’s surface (Figure 6.5). He argued that these small changes in Earth-
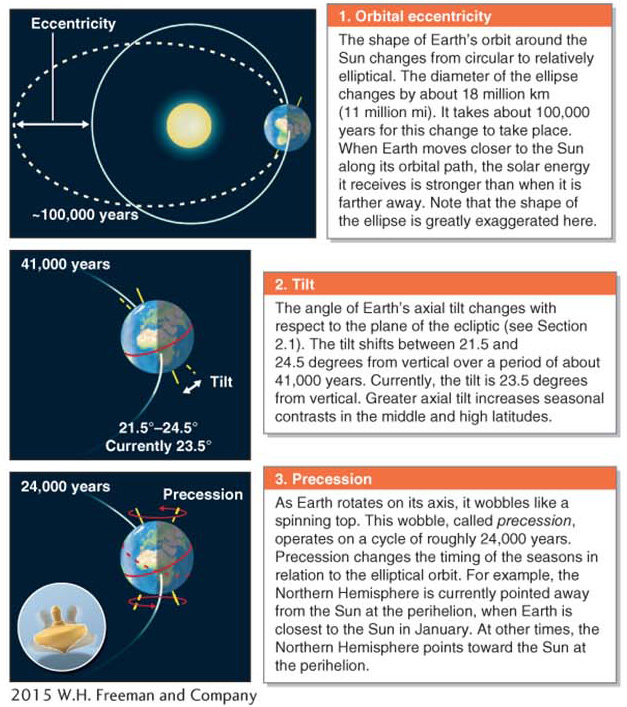
Figure 6.5
 Animation
Milankovitch cycles
http:/
Milankovitch cycles
Small changes in Earth-
Internal feedbacks are important in amplifying the climate changes forced by Milankovitch cycles. Changing Earth-
198
Picture This
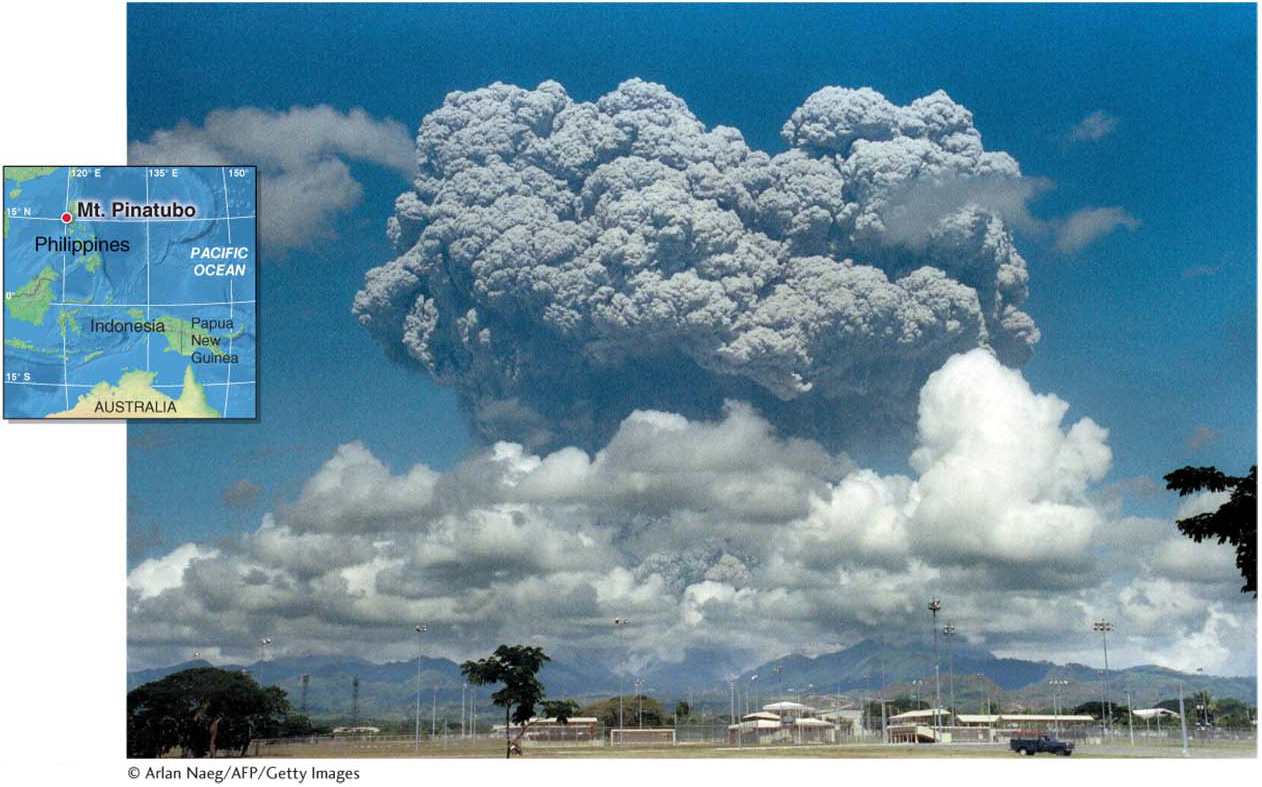
Mount Pinatubo
In June 1991, Mount Pinatubo, in the Philippines, erupted and sent 10 km3 (2.4 mi3) of pulverized rock and ash into the upper atmosphere. Its eruption column was 32 km (20 mi) in vertical height. The veil of aerosols (ash and sulfuric acid droplets) ejected by the volcano spread around the world within weeks and remained suspended in the stratosphere for over five years. The aerosols caused about 1.3°C (2.3°F) of cooling in some regions.
Only the largest volcanic eruptions cause climate cooling. To cause cooling, aerosols must enter the stratosphere, where rainfall will not wash them out of the atmosphere.
Consider This
Question 6.5
eL8TqGg32c6FZ20cu4FRtBq4xqXdA0LkWGXc5bNLzmNUIgN/7el2OU4qUFg=Question 6.6
IYe6d0FN0dc9+9bypoVQghl69OOmblUa90UoqCN5zdtme8Xpn1aovl6ZyR5/M7Puj0ZkM2qud6ABMIRvooyiXGfz/kDPkn8KQ4ENhFvF6ymPS/U8
Milankovitch cycles alter the intensity of sunlight over the seasons, but the Sun’s energy output does not change. The most important aspect of orbital forcing is that it cools the Northern Hemisphere in summer so that snow and ice do not melt. Therefore, snow accumulates and forms continental ice sheets. As the ice sheets grow, the ice-
Climate Anomalies: Random Events
The pattern of climate change is like a layer cake. The bottom layer is the long-
199
Changes in the Sun’s Output
If the Sun’s total energy output were to increase, Earth would warm. If it decreased, Earth would cool. The amount of solar energy reaching Earth, or solar irradiance, has been measured precisely since 1978 by satellites orbiting above the distorting effects of Earth’s atmosphere. During that time, only small variations in the intensity of the Sun’s output have been detected.
solar irradiance
The amount of solar energy that reaches Earth.
Sunspots are dark and relatively cool regions that migrate across the surface of the Sun. About every 11 years, sunspot activity peaks. Dark sunspots are surrounded by regions of unusually high temperatures. As a result, increased sunspot numbers are correlated with a very slight overall increase of energy from the Sun reaching Earth. Ultraviolet radiation increases significantly during high sunspot activity. Fewer sunspots could cool Earth, and more sunspots could warm it.
Although sunspots occur in cycles, not all of them have a discernible effect on Earth’s climate. Instead, these cycles produce random climate events. For example, low sunspot activity may have triggered periodic episodes of cooling, such as the Little Ice Age. High sunspot activity may have triggered periods of warming, such as the Medieval Warm Period (see “The Human Sphere”).
Volcanic Eruptions
Volcanoes are climate wild cards. Nobody knows when a large volcanic eruption capable of causing climate change will happen. When volcanoes erupt, they inject ash and sulfur dioxide into the stratosphere. Sulfur dioxide combines with water to form reflective sulfuric acid droplets. These aerosols may remain suspended in the stratosphere for up to five years, where they reflect incoming sunlight, cooling Earth’s surface. Volcanoes can also cause long-
The eruption of Mount Tambora, in Indonesia, in 1815 was among the largest historical volcanic eruptions. It led to cold summers and failed crops in many regions of the world. In many locations in northern Europe, 1816 was “the year without a summer.” This event is explored further in the Geographic Perspectives in Chapter 14.
Changes in the Ocean Conveyor Belt
Before the 1980s, scientists thought that climate changed from one state to another smoothly and too slowly for humans to perceive. In the 1980s, however, new data indicated that climate can change in a matter of decades or less. Like a precariously balanced bucket that sometimes tips over, the climate system reaches “tipping points,” after which it may change quickly.
Rapid climate change can be caused by positive climate feedbacks that are triggered by climate forcing factors. The resulting behavior of the climate system is referred to as nonlinear because the initial changes within the system are slow at first, then accelerate as positive feedbacks take over and destabilize the system rapidly.
One example of nonlinear climate change was the Younger Dryas cold period (named after a cold-
Younger Dryas
A cold period that occurred 12,900 to 11,600 years ago.
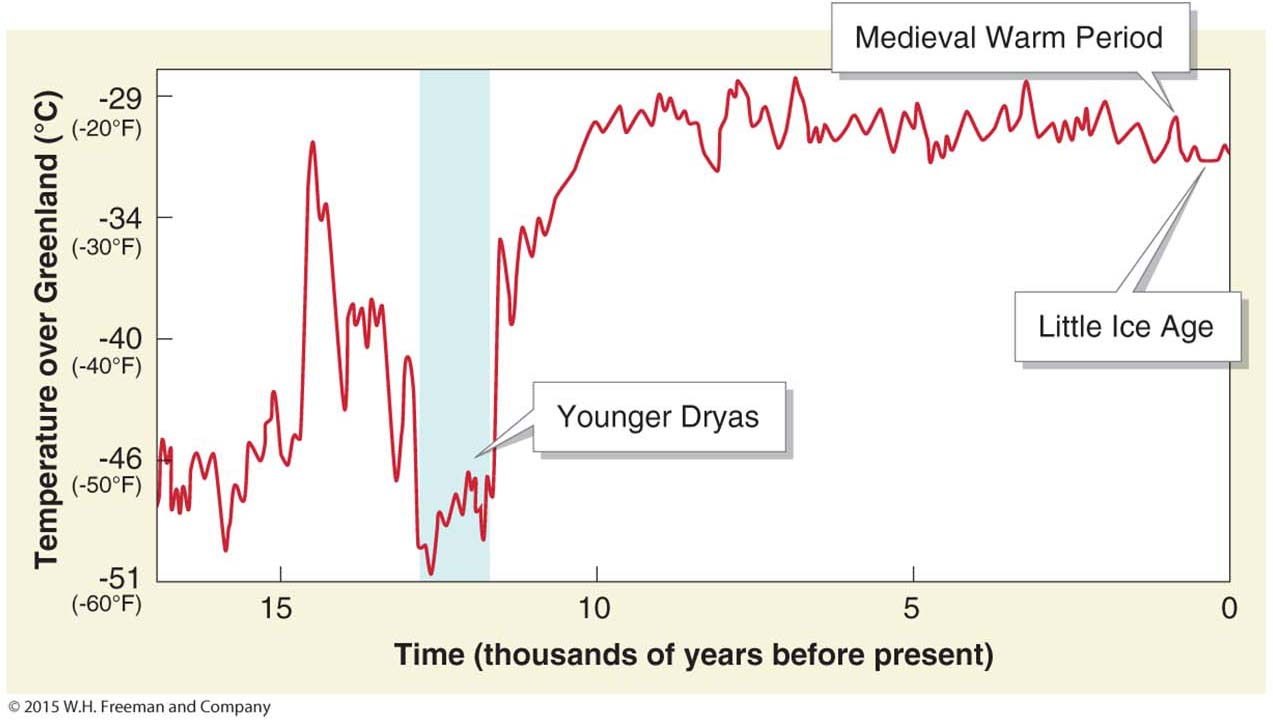
Figure 6.6
What happened almost 13,000 years ago to cause temperatures to plunge so quickly? The answer probably lies in the North Atlantic Ocean. At grocery stores, we often see conveyor belts that transport our groceries from the cart to the cashier. Scientists think that an important part of Earth’s climate system behaves like a conveyor belt. The ocean conveyor belt is the global system of surface and deep ocean currents that transfers heat toward the poles. Its flow depends on differences in the buoyancy of ocean water caused by differences in its temperature and salinity. Colder, saltier water sinks to the depths and warmer, fresher water rises to the surface. Figure 6.7 explains how this system works.
ocean conveyor belt
The global system of surface and deep ocean currents that transfers heat toward the poles.
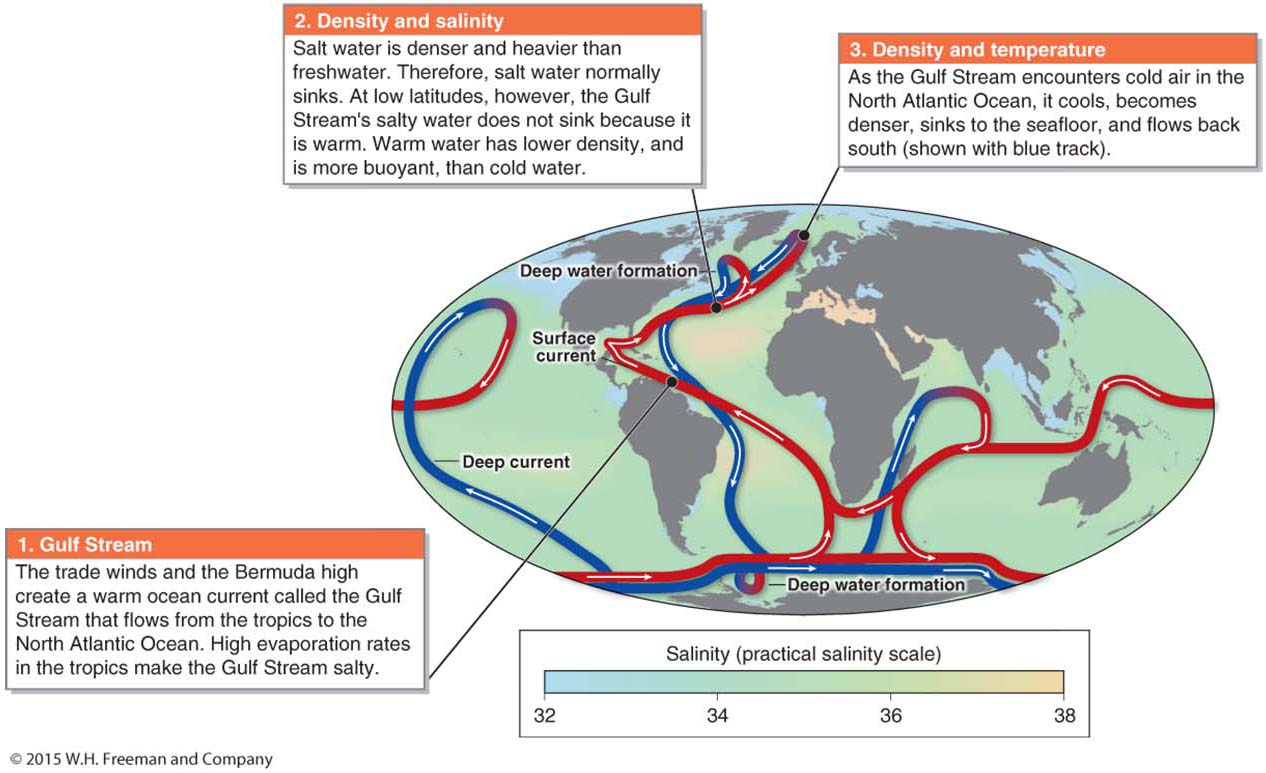
Figure 6.7
200
Scientists think that if the ocean conveyor belt system slows down or stops, the Northern Hemisphere gets colder. Scientists have found evidence that about 12,900 years ago, the ocean conveyor belt system greatly slowed or shut down entirely, plunging most of the Northern Hemisphere into 1,300 years of frigid Younger Dryas climate.
Why would the ocean conveyer belt system slow or shut down? Scientists believe that a massive influx of fresh water into either the North Atlantic Ocean or the Arctic Ocean forced the system to shut down. Why would fresh water shut the system down? Fresh water is more buoyant than salt water. If the Gulf Stream were freshened, it would become more buoyant and would no longer sink in the North Atlantic Ocean as shown in Figure 6.7. If the water did not sink, the current would slow down or stop flowing altogether.
It would take a lot of fresh water to slow the ocean conveyor belt system. Where would such a massive influx of fresh water come from? As Figure 6.8 shows, that water probably came from the melting of the Laurentide ice sheet, the large ice sheet that covered much of North America during the most recent glacial period until about 12,000 years ago.
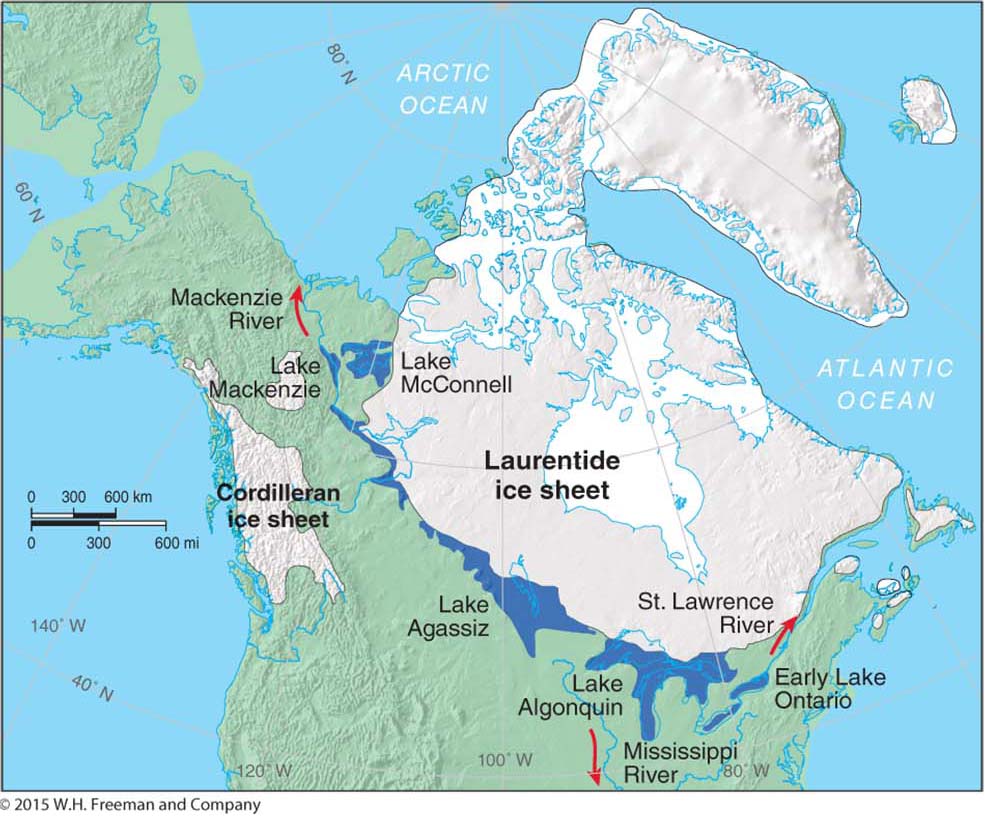
Figure 6.8
Laurentide ice sheet
The large ice sheet that covered much of North America 20,000 years ago.
Reading the Past: Paleoclimatology
How do scientists know what Earth’s climate was like so many thousands of years ago?
201
Question 6.7
How do scientists reconstruct Earth’s ancient climates?
Scientists use tree rings, lake sediments, corals, glacial ice, and other natural materials to reconstruct Earth’s ancient climates.
Earth’s climate history is recorded in various natural archives, such as growth rings in trees, glaciers, and ocean sediments.
Scientists who study Earth’s ancient climates, or paleoclimates, are called paleoclimatologists.They analyze natural Earth materials that record environmental changes in layers that have been left undisturbed. By analyzing these materials, they can reconstruct ancient environments (Figure 6.9).
paleoclimates
Ancient climate.
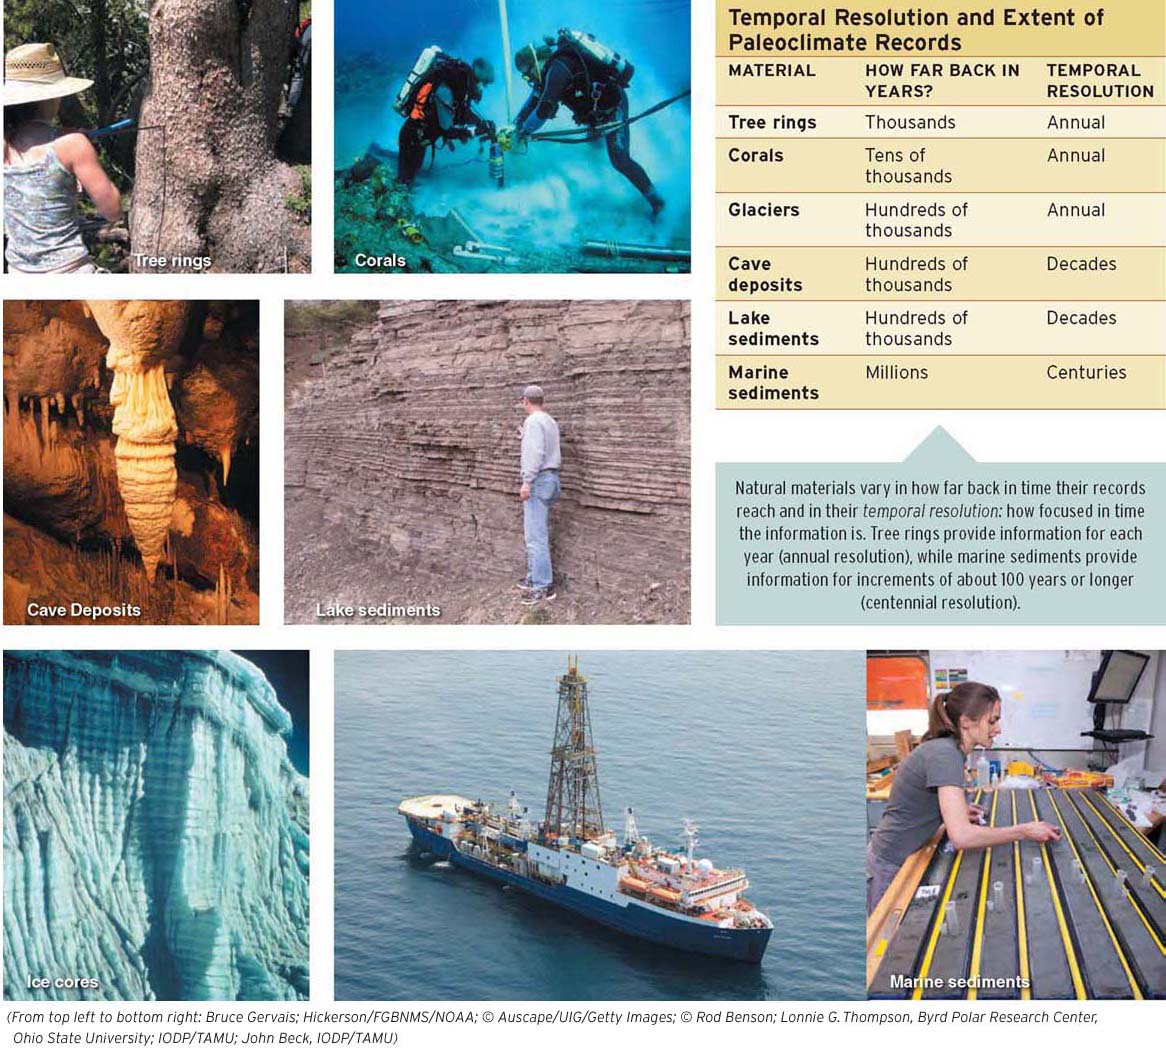
Figure 6.9
202