8.1 Climates and Biomes
Explain the relationship between climate and vegetation structure.
The type of native vegetation found in any given area mainly reflects three physical limiting factors: temperature, water, and light. At a local level, other factors may be important too, such as soil types and biological limiting factors like herbivory and nutrient supplies. In mountain ranges, slope steepness, slope aspect (the direction the slope is facing), and microclimates (the distinct climates of restricted areas) also determine the types of plants that will grow.
When viewed from a small-
biome
An extensive geographic region with relatively uniform vegetation structure.
|
STRUCTURE |
DESCRIPTION |
|---|---|
|
Forest |
Dominated by trees with a closed canopy |
|
Woodland |
Widely spaced trees with a grass understory |
|
Shrubland |
Continuous cover of shrubs |
|
Grassland |
Continuous cover of grasses |
|
Scrubland |
Widely spaced, drought- |
|
Desert |
Sparse plant cover |
Within each biome, plants take on a variety of growth forms, detailed from largest to smallest in Table 8.2. In addition to the names of these plant growth forms, this chapter will use a number of botanical (plant-
|
GROWTH FORM |
DESCRIPTION |
|---|---|
|
Tree |
Tall, upright woody growth |
|
Liana |
Woody, climbing vine |
|
Shrub |
Many woody stems |
|
Forb |
Low, nonwoody plant other than grass |
|
Epiphyte |
Grows on surfaces of trees, not parasitic |
|
Bryophyte |
Member of the division that includes mosses |
|
TERM |
DESCRIPTION |
|---|---|
|
Broad- |
Has wide, flat leaves; usually deciduous |
|
Coniferous |
Bears cones; usually needle- |
|
Deciduous |
Loses all leaves in one season, usually winter |
|
Evergreen |
Loses leaves gradually so it always has leaves |
|
Herbaceous |
Lacking woody tissue |
|
Needle- |
Has narrow, needle- |
|
Sclerophyllous |
Has hard, leathery, and waxy leaves |
|
Woody |
Grows rigid trunks and stems |
Because of the spatial correspondence between climates and biomes, classifying and categorizing climate types is fundamental to this discussion of biomes. One of the most widely used climate classification systems is the Köppen climate classification system, first published by Wladimir Köppen in 1884. The Köppen system categorizes climates based on the temperature and precipitation characteristics of a region. (Appendix 6 provides further detail on the Köppen climate classification system.)
Köppen climate classification system
(pronounced KUHR-
Because of the strong correspondence between vegetation structure and climate, the Köppen climate categories were originally based on the type of natural vegetation growing in an area. There are six major Köppen climate groups containing 25 climate zones. The climate zones and Earth’s biomes are mapped in Figure 8.2.
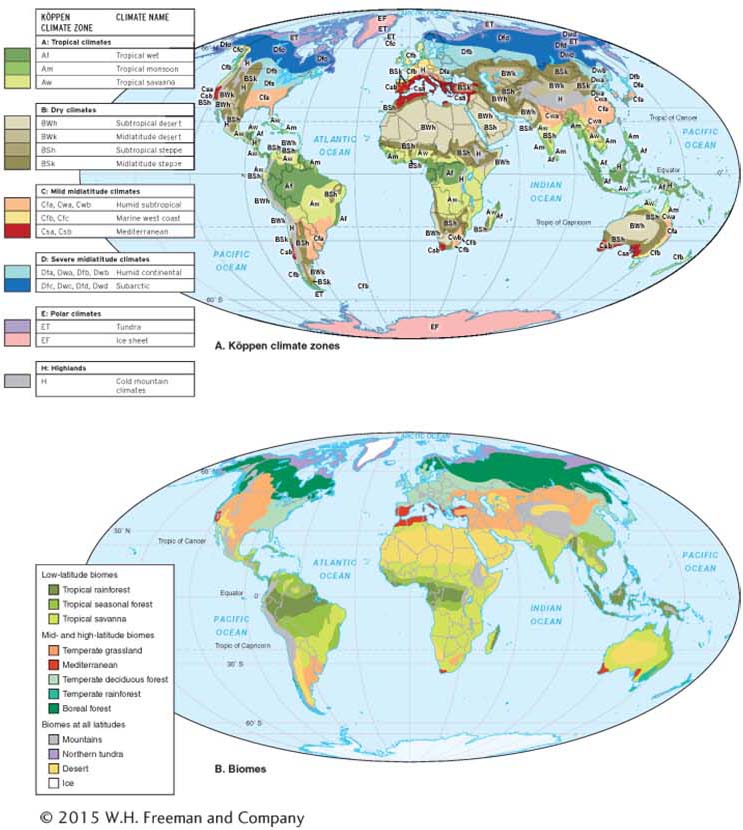
Figure 8.2
Biomes can be portrayed graphically by plotting temperature and precipitation. As shown in Figure 8.3, each biome occupies a different climatological space on the graph.
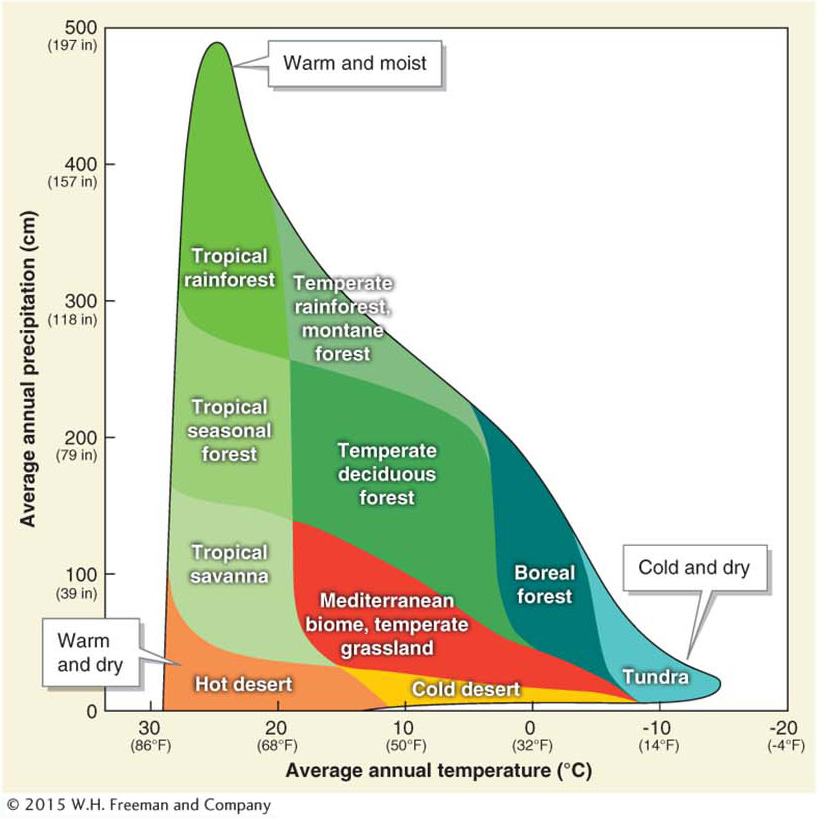
Figure 8.3
 Animation
Biome and climate diagram
http:/
258
259