17.5 Polar Ice Sheets and Sea Level

Assess the role of polar ice sheets in current and future sea-
Alpine glaciers collectively contain enough water to raise sea level by nearly 0.5 m (1.6 ft) if they were to melt entirely. But this amount of water pales in comparison to that contained in the polar ice sheets, as Table 17.1 shows.
|
ICE LOCATION |
APPROXIMATE PERCENTAGE OF CRYOSPHERE |
VOLUME (KM3) |
POTENTIAL SEA- |
POTENTIAL SEA- |
|---|---|---|---|---|
|
Antarctica |
91% |
29,528,300 |
73.32 |
240.54 |
|
Greenland |
8% |
2,620,000 |
6.55 |
21.49 |
|
Alpine glaciers and all other ice |
1% |
180,000 |
0.45 |
1.48 |
|
Total |
100 |
32,328,300 |
80.32 |
263.51 |
|
Data from http:/ |
||||
Given the amount of ice that the ice sheets of Greenland and Antarctica contain, and the rise in global sea level they are capable of causing, scientists have been closely monitoring them for signs of change. Unfortunately, changes are being detected.
The Greenland Ice Sheet Is Changing
The current mass balance of the Greenland ice sheet is negative. Data from Europe’s new CryoSat satellite indicate that as of 2014 Greenland is losing roughly 375 km3 (90 mi3) of ice each year. The ice sheet’s mass is decreasing because its surface is melting and because more of its ice is flowing into the ocean.
Greenland’s albedo has been steadily decreasing as the average temperature of the atmosphere increases and changes the snow cover on the ice sheet’s surface. Greenland’s albedo has decreased in some areas by 18% relative to the 2000–
569
The lowered surface albedo of Greenland and a warming atmosphere create conditions that could lengthen the brief summer melt period. Satellites that have been monitoring Greenland since 1979 have provided evidence that this trend is happening (Figure 17.35).
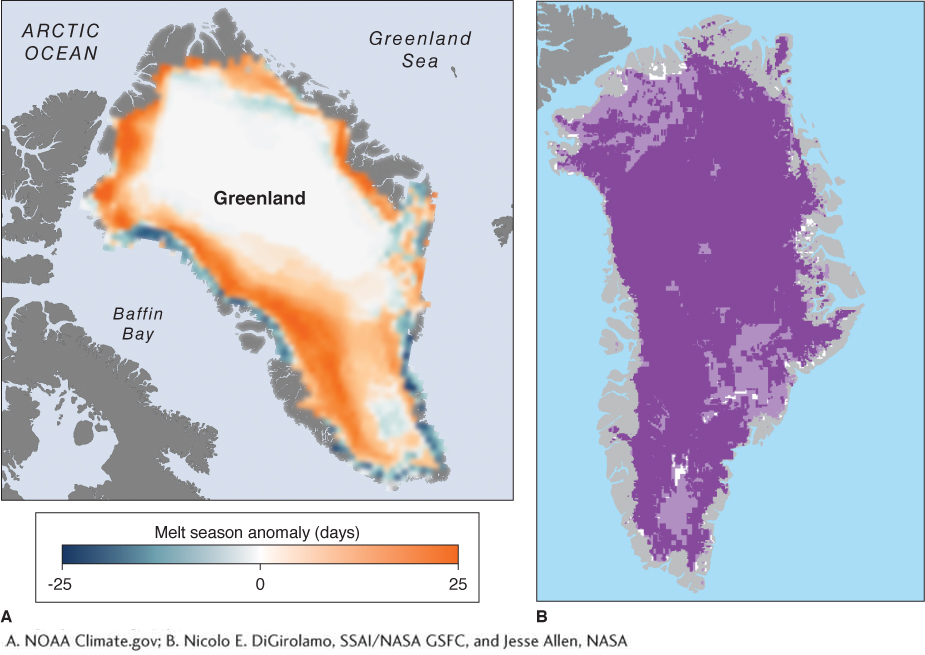
Figure 17.35
Albedo changes and increasing summer snowmelt days are not the full story of ice loss in Greenland. Some of Greenland’s outlet glaciers have more than doubled their rate of flow to the ocean during the last few decades. Scientists are not sure why this is happening, but suspect that supraglacial lakes and moulins that form during the summer snowmelt could play an important role (Figure 17.36). A moulin, a vertical shaft in a glacier through which meltwater flows, may allow meltwater from a supraglacial lake to reach the base of the glacier.
moulin
(pronounced moo-
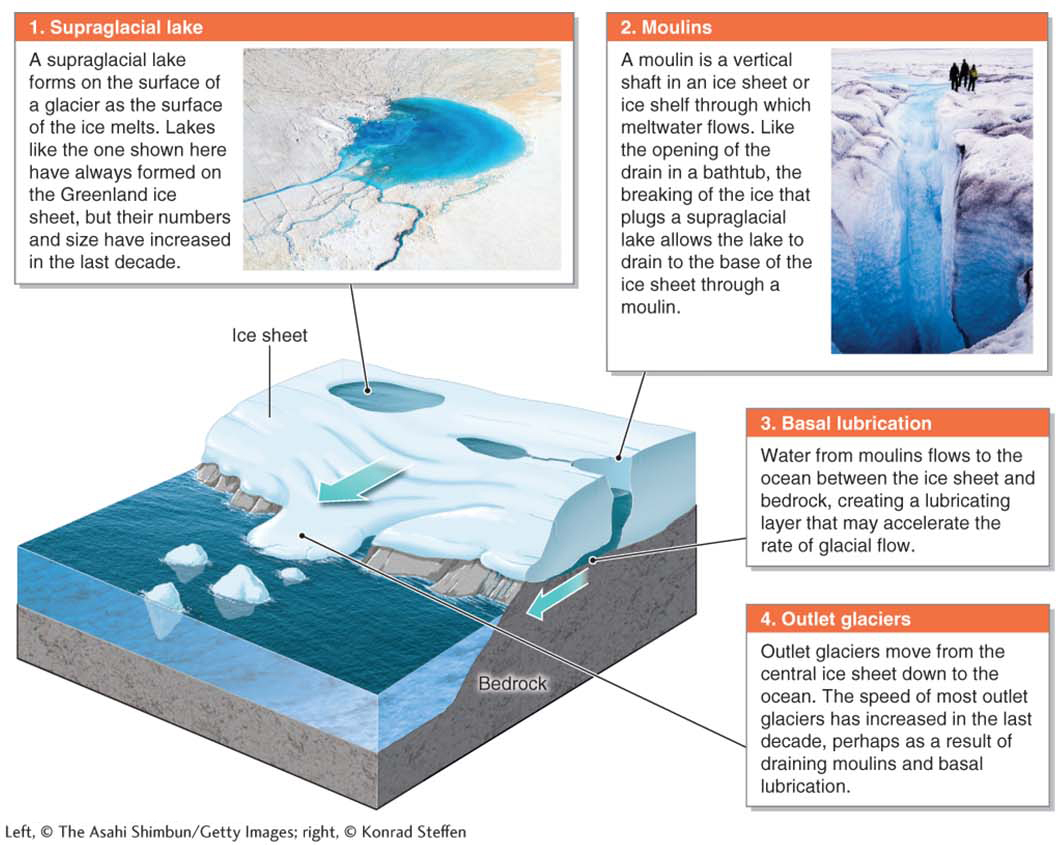
Figure 17.36
570
Recent Changes in Antarctica
Until recently, most scientists assumed that it would take centuries before Antarctica’s climate and ice would begin responding to the warming of the atmosphere. But scientific data are now challenging this assumption. Outlet glaciers that feed into the sea from the main ice sheets of Antarctica form floating ice shelves up to 250 m (800 ft) thick. These ice shelves appear to be sensitive barometers of climate change, as several of them have broken apart in the last several years. Figure 17.37 shows the locations of Antarctica’s ice shelves and recent changes in one of them, the Larsen B ice shelf.
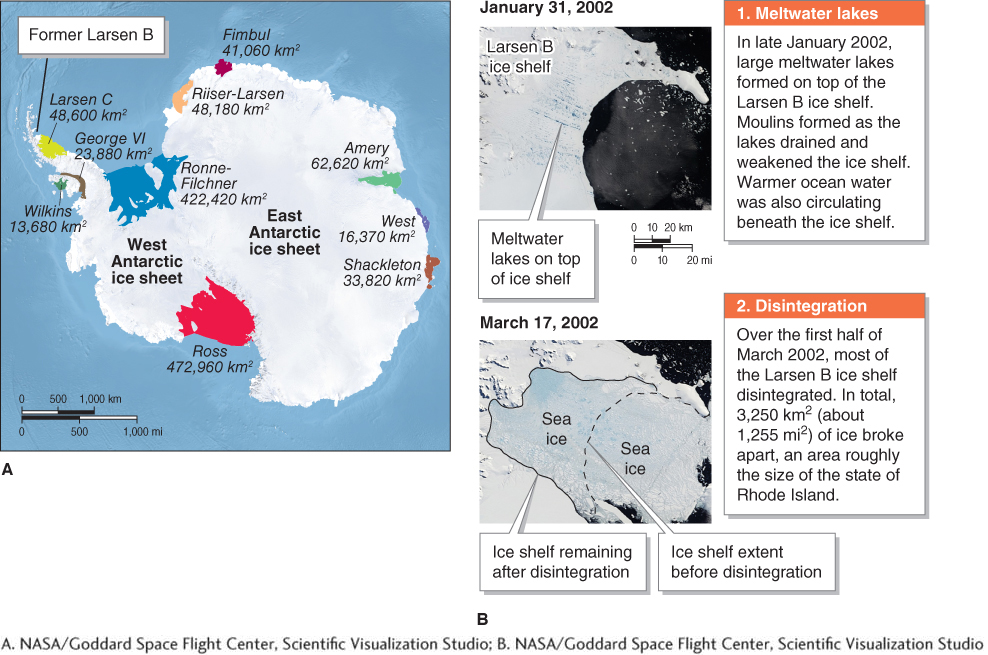
Figure 17.37
 Video
Video
Cryosphere tour
http:/
Because ice shelves are already in the ocean, they do not cause a significant change in sea level when they break apart. The significance of their disintegration is that, once an ice shelf is gone, the outlet glaciers behind it flow to the sea faster because they are no longer slowed by the buttressing effects of the ice shelf. The glaciers that feed the Larsen B ice shelf began flowing about eight times faster after its breakup. Similar accelerated glacial flows have been documented in other regions after smaller ice shelves broke apart.
Research published in Geophysical Research Letters in March 2014 found that the rate of ice flow from six outlet glaciers on the West Antarctic ice sheet increased 75% between 1973 and 2013. These six outlet glaciers drain as much ice as all of Greenland’s outlet glaciers combined. In addition, Europe’s CryoSat shows that Greenland and Antarctica are now draining about 500 km3 (119 mi3) of ice into the ocean each year.
As outlet glaciers from Antarctica flow into the ocean, they cause sea-
571
How Much Will Sea Level Rise?
Between 1900 and 2000, sea level rose by about 20 cm (8 in), at an average rate of about 2 mm (0.08 in) per year. This rate has recently accelerated, and now sea level is rising at 3.2 mm (0.13 in) per year. Thermal expansion of ocean water and melting of alpine glaciers have contributed most to the observed sea-
How much do scientists think sea level will rise? It depends mainly on how these giant ice sheets respond to atmospheric warming. Predicting what they will do is difficult because their behavior is nonlinear, meaning that the rate at which they change can change. For example, if the surfaces of the ice sheets are lowered into warmer air because they are melting, they will melt even faster. Faster melting would lower their elevation even more, triggering a positive feedback. Estimates based on computer modeling indicate that warming of about 1.6°C (2.9°F) above the global pre-
Worldwide, over 100 million people live in coastal areas at elevations within 1 m (3.3 ft) of the high-
572