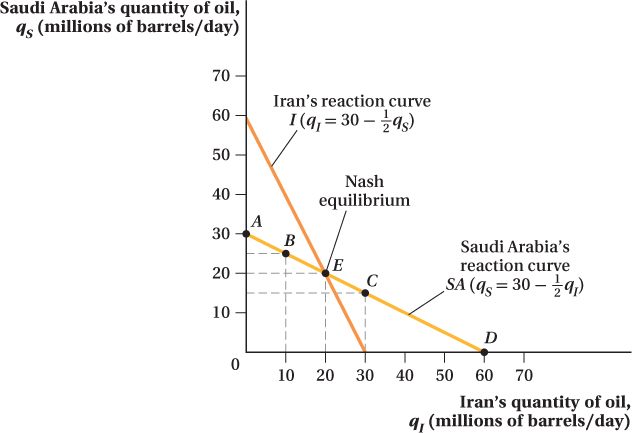
FIGURE 11.4 Reaction Curves and Cournot Equilibrium
A reaction curve represents a firm’s optimal production response given its competitor’s production quantity. SA and I are the reaction curves for Saudi Arabia and Iran, respectively. At point E, where Iran and Saudi Arabia each produce 20 bpd (qI = qS = 20), the market has reached a Nash equilibrium. Here, the two countries are simultaneously producing optimally given the other’s actions.