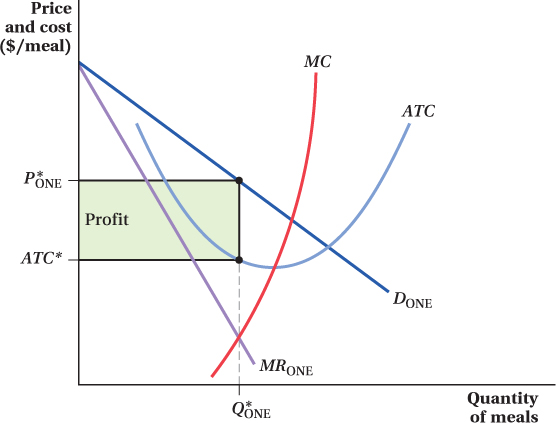
FIGURE 11.6 Demand and Cost Curves for a Monopoly
A monopolist restaurant has demand DONE, marginal revenue MRONE, average total cost ATC, and marginal cost MC. The restaurant produces where marginal revenue equals marginal cost, at quantity Q*ONE. The restaurant’s profit, represented by the shaded rectangle, is the difference between the firm’s price P*ONE and average total cost ATC*, multiplied by Q*ONE.