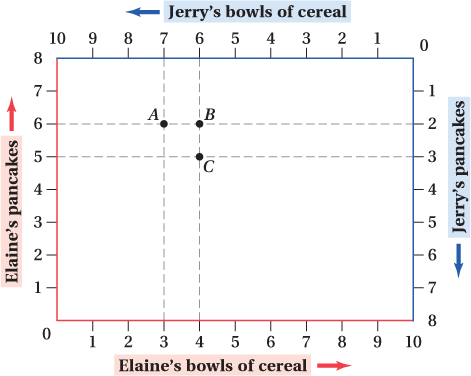
Figure 15.5 A Consumption Edgeworth Box
This Edgeworth box plots specific allocations of cereal (10 bowls total, shown on the horizontal axes) and pancakes (8 total, shown on the vertical axes) between two consumers, Jerry and Elaine. If Jerry consumes 7 bowls of cereal and 2 pancakes, Elaine consumes 3 bowls of cereal and 6 pancakes (point A). If Jerry consumes one less bowl of cereal at point B, then Elaine’s consumption of cereal increases by 1 bowl to 4 bowls of cereal. At point C, Jerry now eats one more pancake, decreasing Elaine’s consumption of pancakes by 1 pancake to 5 pancakes.