Figure 2.5
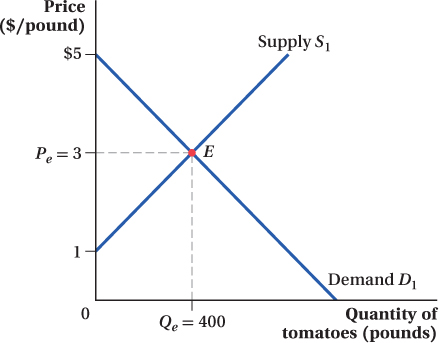
Market Equilibrium
The intersection of the supply curve
S
1
and the demand curve
D
1
at point
E
represents the market equilibrium. The equilibrium price and quantity of tomatoes are $3 per pound and 400 pounds, respectively.