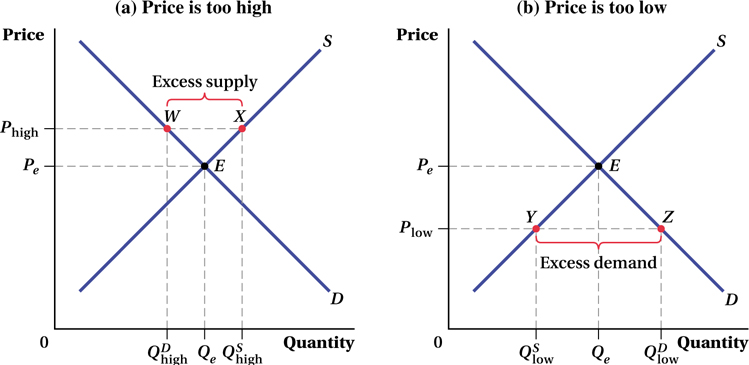
Figure 2.6 Why Pe Is the Equilibrium Price
(a) At the price Phigh above the equilibrium price Pe, producers supply the quantity , while consumers demand only . This results in an excess supply of the good, as represented by the distance between points W and X. Over time, price will fall and the market will move toward equilibrium at point E.(b) At the price Plow below the equilibrium price Pe, producers supply the quantity , while consumers demand . This results in an excess demand for the good, as represented by the distance between points Y and Z. Over time, price will rise and the market will move toward equilibrium at point E.