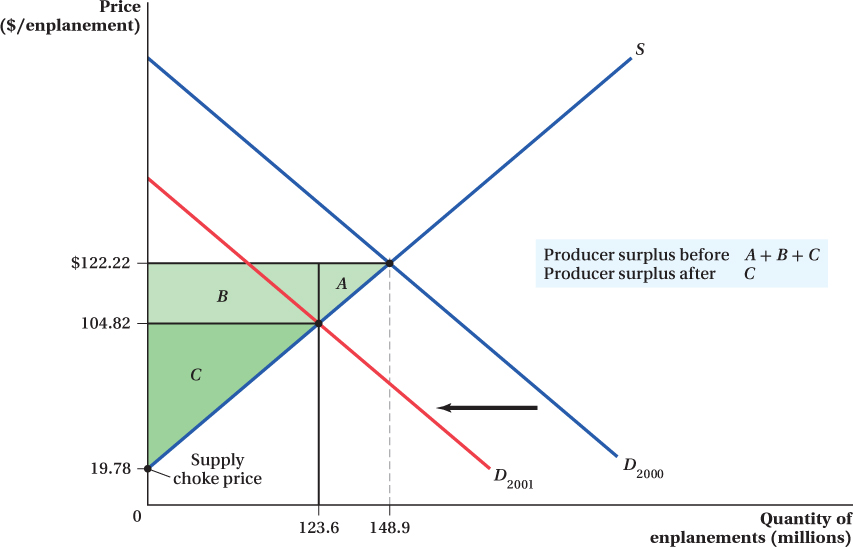
Figure 3.6 Airlines and September 11
After September 11, the demand curve for air travel shifted inward, from D2000 to D2001. In 2000 the equilibrium price and quantity were $122.22 and 148.9 million enplanements, respectively, and the producer surplus was the total shaded area, A + B + C. After September 11, the equilibrium price and quantity fell to $104.82 and 123.6 million enplanements, respectively, and the producer surplus was reduced to the area C. The area A + B represents the loss in producer surplus to the airlines and was over $2.3 billion.