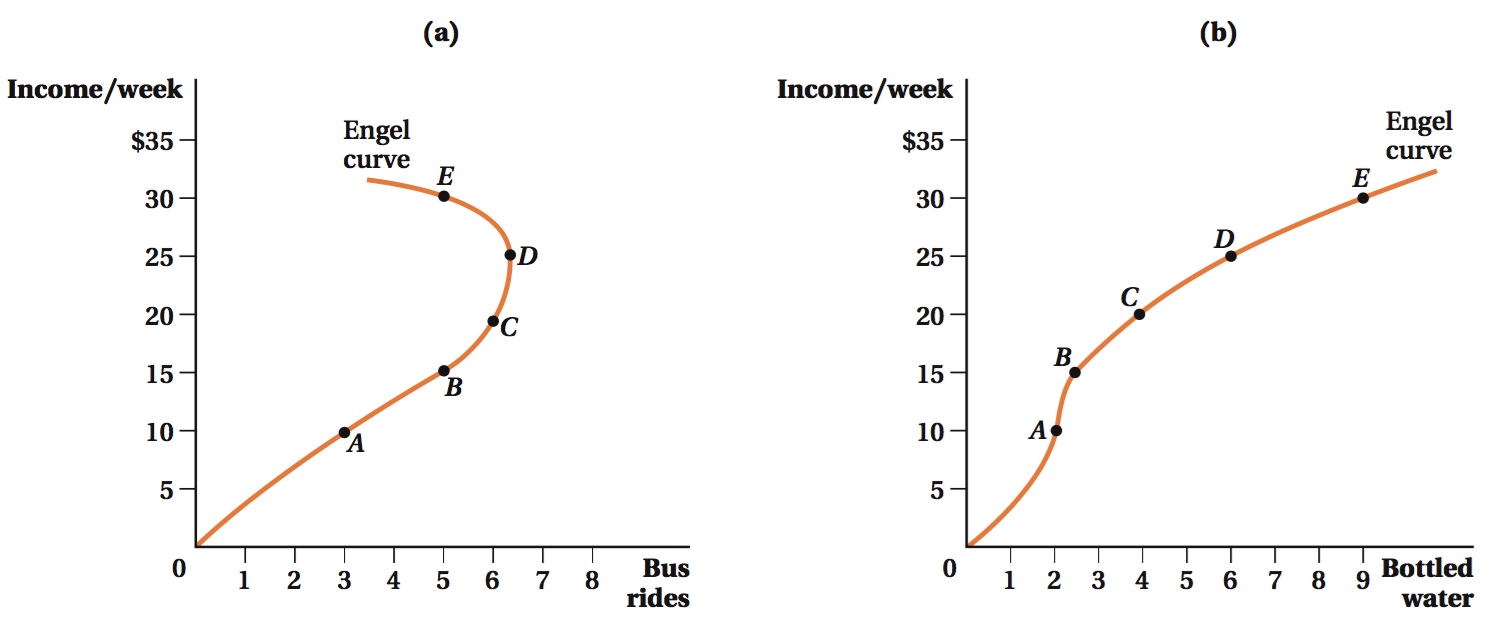
Figure 5.4 Engel Curves Show How Consumption Varies with Income
(a) In contrast to an income expansion path, an Engel curve compares the consumption of a single good to the consumer’s income. As Meredith’s income increases from $10/week to $25/week, her consumption of bus rides increases from 3 to a little over 6 bus rides. At income levels above $25/week, bus rides are inferior goods, and the number of bus rides she takes decreases.(b) Bottled water is a normal good across all income levels shown here. At an income of $10/week at point A, Meredith consumes 2 bottles of water. At point E, Meredith’s income is $30/week, and the number of bottles of water she buys increases to 9 per week.