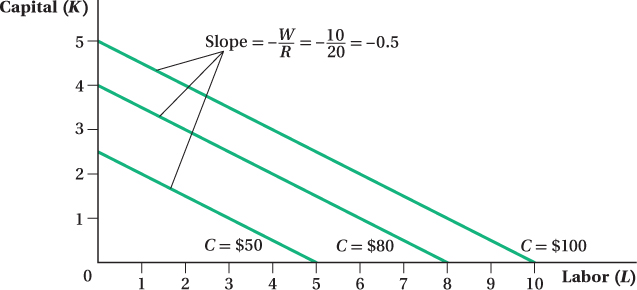
Figure 6.7 Isocost Lines
Each isocost line shows all bundles of inputs that have the same cost to the firm. As you move farther from the origin, the isocost lines represent higher total expenditures, from cost C = $50 to C = $80 to C = $100. For wage W = $10 and rental rate R = $20, the slope of the isocost lines is –W/R, or  . Therefore, for every
 1-
. Therefore, for every