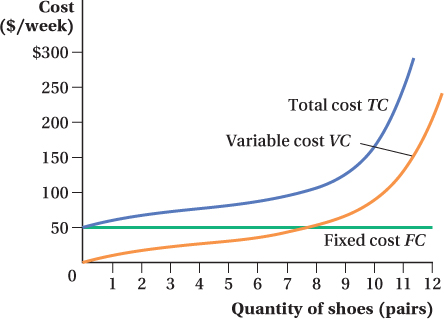
Plotting the values from Table 7.1 generates the total, fixed, and variable cost curves for Fleet Foot (FF). Because fixed cost is constant at $50 per week, the fixed cost curve is horizontal. The variable cost curve rises with output: At lower outputs, it increases with output at a diminishing rate, while at higher outputs, it begins to rise at an increasing rate. The total cost curve is the sum of the fixed and variable cost curves. It runs parallel to the variable cost curve and is greater than the variable cost curve by the amount of the fixed cost.