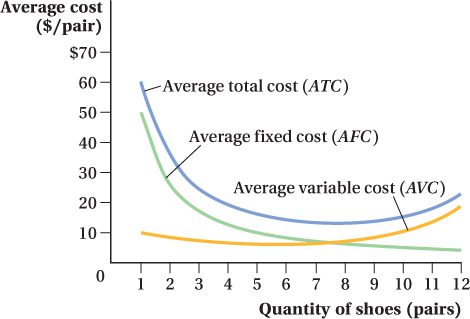
We can construct the average fixed, average variable, and average total cost curves for Fleet Foot using the values from Table 7.2. As FF makes more pairs of shoes, the average fixed cost per pair decreases. The average variable cost initially decreases slightly and then increases after 5 pairs. Average total cost, the sum of average fixed and average variable costs, is U-shaped, and is separated from the average variable cost curve by the value of average fixed cost.