Figure 7.3
Marginal Cost
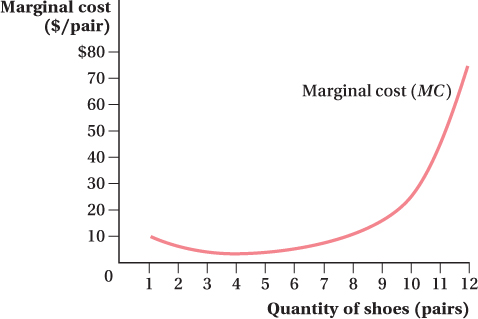
Fleet Foot’s marginal cost curve
MC
shows the additional cost of producing one more pair of shoes. It is
U-
shaped because marginal cost decreases initially and then increases at higher output levels.