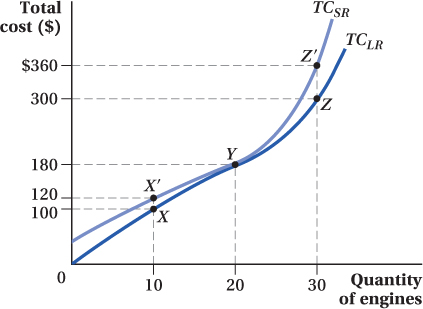
Figure 7.6 Short-Run and Long-Run Total Cost Curves for Ivor’s Engines
The short-run total cost curve (TCSR) for Ivor’s Engines is constructed using the isocost lines from the expansion path in Figure 7.5. At Y, when Q = 20, TCSR and the long-run total cost curve (TCLR) overlap. At all other values of Q, including Q = 10 and Q = 30, TCSR is above TCLR, and short-run total cost is higher than long-run total cost. This is also true when Q = 0 since some input costs are fixed in the short run, while in the long run, all inputs are flexible.