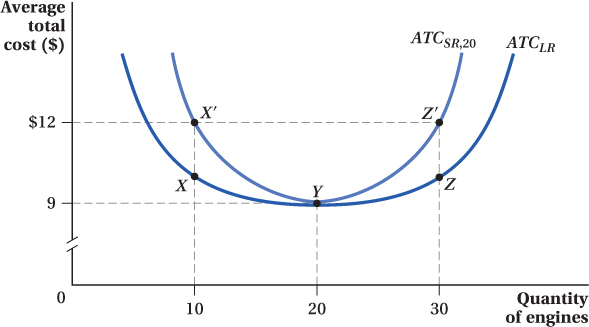
Figure 7.7 Short-Run and Long-Run Average Total Cost Curves for Ivor’s Engines
The short-run average total cost curve (ATCSR,20) and the long-run average total cost curve (ATCLR) are constructed using TCSR and TCLR from Figure 7.6. At Y, when Q = 20 and the cost-minimizing amount of capital is 6 units, the ATCSR and ATCLR both equal $9. At all other values of Q, including Q = 10 and Q = 30, ATCSR is above ATCLR, and short-run average total cost is higher than long-run average total cost.