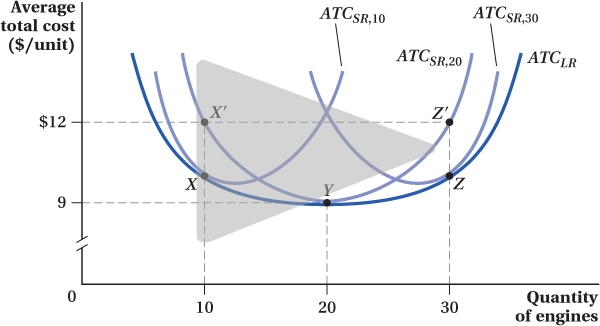
Figure 7.8 Long-Run Average Total Cost Curve Envelops the Short-Run Average Total Cost Curves
ATCSR,10 and ATCSR,30 show short-run average costs when the firm has a fixed capital level that minimizes the total costs of making 10 and 30 engines, respectively. With and , ATCSR,10 and ATCSR,30 overlap ATCLR at the cost-minimizing points X and Z, respectively. However, X and Z are not at the lowest points on ATCSR,10 and ATCSR,30 because the output levels that minimize ATCSR,10 and ATCSR,30 can be produced more cheaply if capital inputs are flexible.