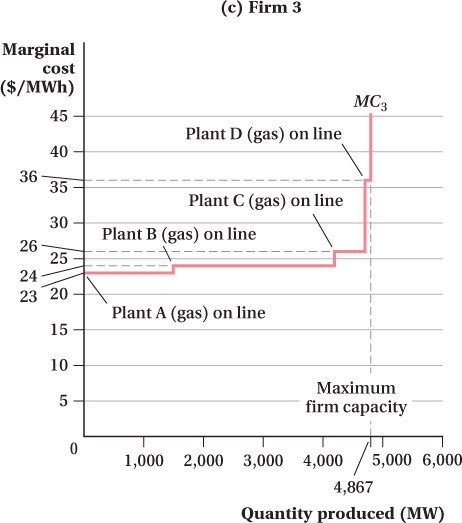
Figure 8.12 Differing Marginal Cost Curves across Electricity Producers
Firms 1, 2, and 3 have the marginal cost curves reflected in panels a, b, and c, respectively. While Firms 1 and 2 have both coal and natural gas plants, Firm 3 relies only on the relatively more expensive natural gas generators.