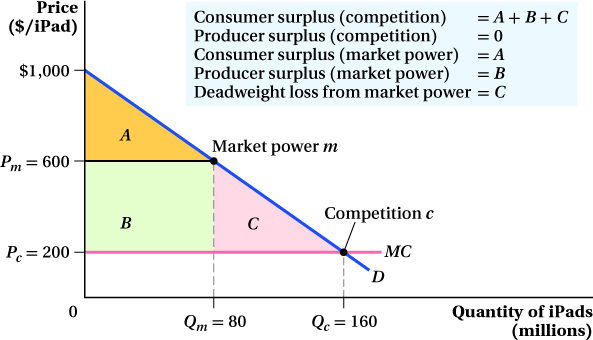
Figure 9.6 Surplus from the Apple iPad
We can compute Apple’s producer surplus, consumer surplus, and deadweight loss using the marginal cost curve, the demand curve, and the profit-maximizing output and price levels. Consumer surplus is the area of triangle A, equal to or $16 billion. The producer surplus, rectangle B, is (80 million) × ($600 – $200) or $32 billion. The deadweight loss is triangle C and can be calculated as ($600 – $200) or $16 billion.