Problems
538
(Solutions to problems marked * appear at the back of this book. Problems adapted to use calculus www.macmillanhighered.com/
Tessa’s Techs is a small, competitive firm that provides online and telephone support for people with computer problems. The marginal product of labor (measured in numbers of support requests fulfilled per shift) is given in the table below:
Units of Labor MPL MRPL 1 14 2 12 3 10 4 8 5 6 If Tessa’s charges $6 for each service call, calculate the marginal revenue product of labor for Tessa’s Techs.
Suppose Tessa can hire workers for $60 per four-
hour shift. Explain why, if Tessa currently has just one employee, she isn’t maximizing her profits. How much will her profits increase if she hires a second worker? Suppose Tessa can hire workers for $60 per four-
hour shift. Explain why, if Tessa hires five employees, she isn’t maximizing her profits. Determine the optimal number of employees for Tessa to hire.
Offer two explanations why, at below profit-
maximizing levels of output, a firm is likely to find that its MRPL is greater than the prevailing market wage. What happens to the firm’s MRPL as output expands, and why? Does your answer depend on whether the firm has market power? If a firm can increase profit by expanding output, then the benefit from hiring another worker (marginal revenue product) exceeds the cost of hiring another worker (the wage rate). Also, since the marginal product of labor typically declines as more workers are hired, it will be larger at low levels of output. If the marginal revenue product of labor is equal to the wage at the profit-
maximizing point, then it will be above the wage at output levels below that point. This relationship is true regardless of whether the firm has market power. It stems from the assumption of diminishing marginal product of labor. Consider the situation facing Tessa, the owner of Tessa’s Techs in Problem 1.
Draw Tessa’s demand curve for labor. Then, draw the supply curve for labor that Tessa faces. (Hint: Remember that the demand for labor equals the marginal revenue product of labor.)
On your graph, indicate the profit-
maximizing quantity of labor for Tessa to hire. Suppose that Microsoft releases a particularly bug-
prone version of Windows that causes the demand for service calls to increase. The increase in demand for service calls drives up the market price of a service call from $6 to $10. Draw Tessa’s new demand for labor, and determine the number of workers Tessa should hire. Does the change you illustrated in (c) help explain why the demand for labor is called a derived demand?
The market for nurses is highly competitive on both the supply and demand side. Suppose a hospital is trying to determine how many nurses to hire.
Graph the hospital’s supply and demand for labor to illustrate how the hiring decision will be made.
Suppose that a relative scarcity of nurses drives up the market wage nurses receive. Illustrate this increase in the market wage in your graph.
Does the increase in the market wage for nurses reduce the demand for nurses? Explain.
Show what happens to the demand for nurses and the hiring of nurses when a new type of medical equipment enables them to serve more patients each hour.
The real wage a firm pays its employees measures the number of units of output the firm must sell in order to pay an employee’s dollar wage.
If employees at a whipped cream factory earn $21 per hour and whipped cream sells for $3 per carton, determine the real wage the workers are being paid. In what units is your answer expressed?
Express the real wage more generally as a function of the dollar wage and the firm’s output price.
To maximize profits, a firm should hire labor until the marginal revenue product of labor equals the dollar wage. Show that a competitive firm should hire workers until the marginal product of labor is equal to the real wage.
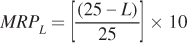
The house painting industry is highly competitive on both the input and output side. The marginal product of labor faced by a typical firm in the industry is given by MPL = 25 – L, where L is the number of workers hired and MPL is measured in square feet painted per hour. Firms typically charge their clients $10 per 25 square feet painted.
Determine the marginal revenue product of labor faced by the typical firm.
At what wage will firms not want to hire any workers at all?
Firms will not want to hire any workers at all when the wage is higher than the MRPL of the first worker. That is, when the wage is higher than $9.60 per hour.
If workers worked for free, how many workers would the typical firm hire? Explain intuitively why the firm should not hire any more.
The firm would not want to hire workers to the point where marginal product is negative. At 25 workers, marginal product is zero. So 25 workers would be the maximum they would allow on the job, even if painters worked for free.
If the prevailing market wage for house painters is $20 per hour, how many workers should the typical firm hire?
Zero. There is no quantity of labor at which marginal product would be 50 square feet, which is what it would have to be in order to pay a wage of $20.
Suppose a new paint formulation requires fewer coats, increasing workers’ marginal products to MPL = 35 – L. How will this new paint affect the hiring decisions of employers?
With this innovation, the marginal revenue product of labor would become [(35 – L)/25] × 10. At any given wage rate, the quantity of labor hired would be greater than before.
539
Crazy Eddie is the world’s worst politician. At a recent political rally, he told the crowd, “This country was founded on hard work. If elected, I plan to encourage that work by raising income taxes.” Is it possible that Crazy Eddie is right—
that increasing income taxes could cause people to work more? Explain your answer, being sure to mention income and substitution effects. Consider Jillian, whose backward-
bending labor supply curve is shown in the figure below. Above $50 per hour, increases in wages cause Jillian to work less and enjoy more leisure. That implies that leisure is a normal good. True or false: It must then be the case that below $50 per hour, leisure is an inferior good. Explain your answer. 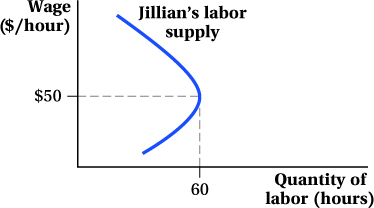
Indicate whether the following statement is true or false, and explain your answer: Because firms can substitute capital for labor in the long run, the demand for labor must be less elastic in the long run than in the short run.
In Glutonia, there are 1,000 bakers who buy flour to bake into bread. The marginal revenue product of flour faced by each baker is MRPF = 60 – 0.01Q. The flour market in Glutonia is perfectly competitive.
Each baker’s inverse demand for flour is simply his or her marginal revenue product for flour. Add up the demands of all 1,000 bakers to find the market demand for flour. (Hint: Solve each baker’s MRPF equation for Q, then multiply by 1,000.)
The inverse demand is:
P = 60 – 0.01Q
Solve for Q to find the demand equation for each individual baker:
0.01Q = 60 – P
Q = 6,000 – 100P
Multiply by 1,000 to find the demand for the market as a whole:
Qd = 6,000,000 – 100,000P
The market supply of flour is given by QS = 150,000P. Solve for the market price of flour.
The market price can be found by setting quantity supplied equal to quantity demanded:
150,000P = 6,000,000 – 100,000P
250,000P = 6,000,000
P = 24
At the price you found in (b), how many units of flour to bake into bread will each baker choose to purchase?
Use the individual demand from part (a) to find the amount of flour each baker will buy at a price of $24:
Q = 6,000 – 100(24) = 3,600 units of flour
Verify that the total amount demanded by all 1,000 bakers equals the equilibrium quantity in the market.
According to the market demand from part (a), the market quantity will be:
Qd = 6,000,000 – 100,000(24) = 3,600,000
SB-
24 This number is consistent with each of the 1,000 bakers buying 3,600 units each:
3,600 × 1,000 = 3,600,000
Suppose that a decrease in the price of bread reduces the marginal revenue product of flour to MRPF = 60 – 0.02Q. Find the new market price and quantity, as well as the quantity purchased by each baker.
The inverse demand is the marginal revenue product of labor:
P = 60 – 0.02Q
Convert this to a demand equation by solving for Q:
0.02Q = 60 – P
Q = 3,000 – 50P
This is the demand for each individual baker.
To find the demand for the market as a whole, multiply by 1,000:
Qd = 3,000,000 – 50,000P
The market price can be found by setting quantity supplied equal to quantity demanded:
150,000P = 3,000,000 – 50,000P
200,000P = 3,000,000
P = 15
The market quantity will be 3,000,000 – 50,000(15) = 2,250,000.
Each of the 1,000 bakers will purchase 3,000 – 50(15) = 2,250 units of flour.
Tilda grows Brussels sprouts and is a monopsony buyer of labor in her small town. The labor supply she faces is given in the following table and shown in the accompanying graph.
Wage ($/hour) Quantity of Labor Total Expenditure on Labor Marginal Expenditure on Labor $10 1 $11 2 $12 3 $13 4 $14 5 Calculate Tilda’s total expenditure on labor if she wants to hire one worker, and fill in the appropriate cell in the table. Then, figure out how much Tilda would have to spend to hire two workers, three workers, and so on.
Calculate Tilda’s marginal expenditure on labor for the first worker, the second worker, and so on. Fill in the marginal expenditure column in the table.
Carefully graph the values from the Marginal Expenditure on Labor column in the graph provided.
Describe how the marginal expenditure curve you graphed behaves, relative to the labor supply curve.
Suppose that the government of a small equatorial country requires all coconut producers to sell their output to the government. According to the text, a monopsony buyer’s marginal expenditure is given by ME = P + (ΔP/ΔQ) × Q, where Q is the quantity of coconuts and P is the market price of coconuts.
Show that the marginal expenditure faced by the government is ME = P × (1 + 1/εs), where εs is the elasticity of supply of coconuts. [Hint: Multiply and divide (ΔP/ΔQ) × Q by the same variable.]
540
Show that the government’s marginal expenditure on coconuts will always be greater than or equal to the price of coconuts.
Use the formula you derived to explain why, if the buyer’s side were competitive, marginal expenditure would equal price.
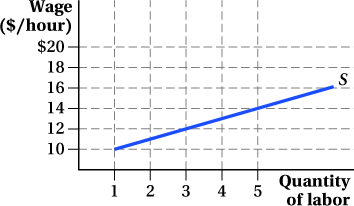
In a coal-
mining company town, one employer is the sole buyer of labor services. The labor supply curve is given by QL = –700 + 100W. Invert the labor supply curve so that the wage is expressed in terms of the quantity; then graph the quantity of labor supplied at each possible wage.
Find the firm’s marginal expenditure curve, and graph it.
Explain why the firm’s marginal expenditure is higher than the labor supply curve at all possible hiring levels.
The company town in Problem 13 estimates that the marginal revenue product of labor is given by MRPL = 19 – 0.02L.
Equate the firm’s marginal revenue product of labor and marginal expenditure to find the profit-
maximizing level of labor input. Use the labor supply curve to determine the wage the coal-
mining firm must pay.
The following diagram shows the marginal revenue product of labor and the supply of labor in the production of lemongrass.
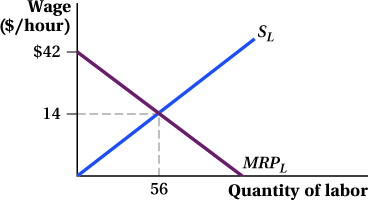
Express the marginal revenue product of labor in the lemongrass industry mathematically.
Express the supply of labor in the lemongrass industry mathematically.
If lemongrass production were competitive in both input and output markets, how many workers would be hired and what wage would they be paid?
A ruthless lemongrass producer drives all other lemongrass producers out of town with dire threats. That producer becomes a monopsonistic buyer of labor. Find the marginal expenditure curve facing that employer. Then, graph the marginal expenditure curve.
How many units of labor will a monopsonistic lemongrass producer hire? How much will the workers be paid?
By how much does employment fall when the labor market goes from competitive on the buyer’s side to monopsonistic?
Calculate the deadweight loss of monopsony and illustrate it on the graph. Is eliminating competition on the buyer’s side of the labor market a good thing for society, or a bad thing?
In a tourist-
destination city, the market for ATM fillers is perfectly competitive. The demand for ATM fillers is given by L = 200 – 5W, where L is the number of workers desired and W is their wage. On the supply side of the market, the marginal cost of providing ATM fillers is given by MC = 0.5L. Find the inverse demand for ATM fillers. Then, equate supply and demand for ATM fillers to find the equilibrium quantity of ATM fillers hired in a competitive market.
Begin with the demand function, and solve for W:
L = 200 – 5W
5W = 200 – L
W = 40 – 0.2L
Then, set the wage equal to marginal cost:
40 – 0.2L = 0.5L
40 = 0.7L
L ≈ 57
Fifty-
seven ATM fillers would be employed in a competitive market. Find the equilibrium wage of ATM fillers.
W = 40 – 0.2(57) = 28.60
Tired of exploitation by large bank systems, ATM fillers decide to unionize and sell their services collectively. Derive the marginal revenue curve faced by the newly formed ATM fillers’ union.
Using the rule that the marginal expenditure curve has twice the slope of the labor supply curve if the latter is linear, we find:
MR = 40 – 0.4L
Suppose the ATM fillers’ union decides to maximize profits. Equate marginal revenue and marginal cost to determine how many ATM fillers will be employed. What wage will they be paid?
If MR = MC, then:
40 – 0.4L = 0.5L
40 = 0.9L
L ≈ 44
W = 40 – 0.2(44) = 40 – 8.8 = 31.20
Forty-
four workers would be hired at a wage of $31.20. The unemployment rate is the percentage of workers who are willing to work at a given wage but who are not actually working. Determine how many workers would like to work at the union wage; then calculate the unemployment rate created by unionization.
Use the wage in the supply (marginal cost) equation to find the number of workers willing to work at a wage of $31.20:
MC = 0.5L = W
L = 2W
L = 2(31.20) ≈ 62
Sixty-
two workers would be willing to work at this wage, but only 44 will be employed. The unemployment rate is: 
Suppose that the employment of elevator mechanics is controlled on the supply side by a union. Is it better for the union to attempt to maximize the profits of its membership, or to maximize the total wages its members receive? Is it better for society if the union attempts to maximize its profits, or the total wages its members receive? Explain your answer using a graph.
An oil-
well fire is raging in Texas. The Texas state government is trying to hire International Well Control, a famed oil- well firefighting firm. Explain why the models of the labor market developed in this chapter are unable to predict how much Texas will eventually pay to put out the horrific blaze. This is a case of bilateral monopoly. International Well Control may be the only firm Texas is willing to use, giving the firm a measure of monopoly power. Also, the State of Texas has some measure of monopsony power because it is one of a handful of government entities needing to purchase this service. Consequently, negotiating skills and bargaining power play a significant role in determining the amount Texas will pay.