2.3 Supply
We have one half of the supply and demand model assembled. In this section, we present the supply half. By supply we mean the combined amount of a good that all producers in a market are willing to sell.
Factors That Influence Supply
Just as there are many factors that determine demand, there are also factors that determine supply. Let’s discuss these again in the context of our Pike Place Market tomatoes example.
Price Just as it does with demand, price plays an important role in supply decisions. If farmers expect to be able to sell tomatoes at $40 a pound at Pike Place Market, the market will be loaded with them. The farmers will grow more tomatoes and choose to sell them at Pike Place Market rather than other outlets. If they expect the price to be only $1 per pound, there will be a much smaller quantity available for sale.
Suppliers’ Costs of Production Suppliers’ production costs will change when input prices and production technology change. There are many inputs a supplier must use to produce tomatoes and bring them to market, including land, tomato seeds, harvesting equipment, or gasoline needed to ship tomatoes to markets, to name just a few. If the prices of these inputs change, the suppliers’ costs will change and will influence the quantity of tomatoes supplied to the market.
production technology
The processes used to make, distribute, and sell a good.
Similarly, changes in production technology, the processes used to make, distribute, and sell a good such as tomatoes, will change the costs of production. The more efficient these processes are, the lower the costs to sellers of providing tomatoes for sale. Lower costs will raise sellers’ willingness to supply tomatoes at a particular price.
The Number of Sellers More farmers bringing tomatoes to Pike Place Market will raise the available supply.
Sellers’ Outside Options Farmers who are busy selling tomatoes at Pike Place Market aren’t selling some other product or selling tomatoes at some other place. A change in farmers’ prospects for doing business in markets for other goods or in other markets for tomatoes can affect their willingness to supply tomatoes at Pike Place Market. These prospects depend on factors such as the prices of other goods the farmers might be growing and selling (radishes, peppers, or green beans) or tomato prices at markets other than Pike Place Market.
Supply Curves
supply curve
The relationship between the quantity supplied of a good and the good’s price, holding all other factors constant.
Just as we introduced demand curves as a way to think in a more focused way about demand, we can do the same thing for supply. Supply curves, like demand curves, capture the idea that factors that influence supply can be divided into two sets: price and everything else. Supply curves isolate the relationship between price and quantity supplied.
19
Graphical Representation of the Supply Curve Figure 2.3 depicts a supply curve for tomatoes at Pike Place Market. The vertical axis reflects the price of the good, and the horizontal axis is the quantity supplied. The curve indicates that, for example, if the price of tomatoes is $2 per pound, 200 pounds of tomatoes will be offered for sale. If the price is $5 per pound, the quantity supplied will be 800 pounds.
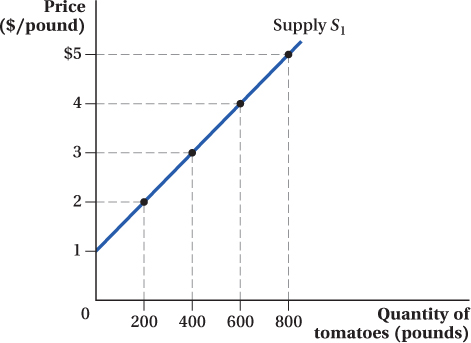
The supply curve in the figure slopes upward: Holding everything else equal, producers are willing to supply more of a good as price rises.5 Many firms experience increasing costs of production as their output rises. When this is the case, they need to earn a higher price in the market in order to induce them to produce more output.
Mathematical Representation of the Supply Curve The supply curve in Figure 2.3 is expressed mathematically as
Q = 200P – 200
supply choke price
The price at which no firm is willing to produce a good and quantity supplied is zero; the vertical intercept of the inverse supply curve.
inverse supply curve
A supply curve written in the form of price as a function of quantity supplied.
where Q is the quantity supplied (in pounds of tomatoes) and P is the price in dollars per pound. This indicates that holding everything else constant, for every dollar increase in price, the quantity supplied of tomatoes increases by 200 pounds. For this supply curve, the supply choke price (the price at which quantity supplied equals zero) is $1. The inverse supply curve (price as a function of quantity supplied) is P = 0.005Q + 1.
Shifts in the Supply Curve
A given supply curve such as S1 in Figure 2.3 illustrates how the quantity supplied of a good changes as its price, and only its price, changes.
20
When one of the other (nonprice) factors that affect supply changes, the change affects the quantity of tomatoes that suppliers want to sell at every price. For example, if someone invents a machine that can harvest tomatoes faster and at lower cost, producers who wanted to produce 600 pounds of tomatoes at $4 per pound will now be willing to supply 800 pounds of tomatoes at $4. Those who were willing to supply 200 pounds at $2 will now be willing to supply 400 at $2, and so on. Because producers supply more tomatoes at any particular price, the whole supply curve will shift out to the right from S1 to S2, as shown in Figure 2.4. The way we’ve drawn it, that additional quantity is the 200 pounds at any price, though there’s nothing that says all supply shifts must exhibit this pattern.6 Mathematically, the supply curve S2 is described by the equation Q = 200P.
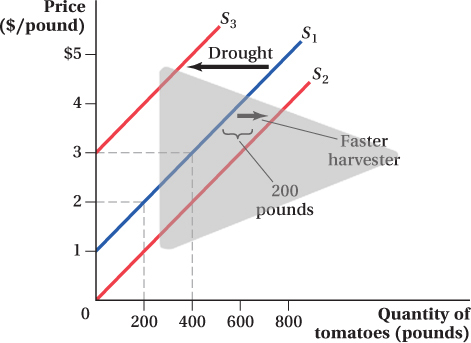
Similarly, if there is a drought, it will cost producers more to irrigate their fields. They will want to supply fewer tomatoes at any given price than they did before, and the supply will shift up and to the left, to S3. Mathematically, the supply curve S3 corresponds to Q = 200P – 600.
change in quantity supplied
A movement along the supply curve that occurs as a result of a change in the good’s price.
change in supply
A shift of the entire supply curve caused by a change in a determinant of supply other than the good’s own price.
Analogous to demand curves, the changes in a good’s price when everything else stays constant lead to changes in quantity supplied, movements along a supply curve. Changes in any other factors that influence supply change the quantity supplied at any given price and create shifts in the supply, which is called a change in supply.
Why Is Price Also Treated Differently for Supply?
Supply curves isolate the effect of prices on supply just as demand curves isolate price effects on demand. We mentioned one of the big reasons for this focus on price in the demand curve is that price is the only factor that has a direct influence on both supply and demand. Price is the critical element that ties together the two sides of a market. Price’s roles in both the supply and demand sides of a market mean that prices can adjust freely to make the quantity demanded by consumers equal to the quantity supplied by producers. When this happens, we have a market in which everyone who wants to buy at the current price can do so, and everyone who wants to sell at the current market price can do so as well.
21
As we see in the next section, we can also use the supply and demand model to predict how changes in nonprice factors affect market outcomes. To get to the point where we can do that, however, we need to identify an initial market price and quantity sold. Treating price as special allows us to do that.