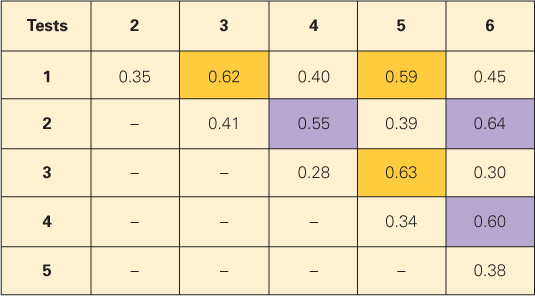
Figure 10.9: Hypothetical correlations among test scores, suggestive of two underlying intelligences Each coefficient in the matrix is the correlation between the two tests indicated by its row and column. Thus, 0.35 is the correlation between test 1 and test 2. All the correlations are positive. Notice, however, that the correlations among tests 1, 3, and 5 (in gold) and among tests 2, 4, and 6 (in purple) are higher than any of the other correlations. This pattern of correlations suggests that the tests measure two different but somewhat overlapping abilities. Tests 1, 3, and 5 are the best measures of one ability, and tests 2, 4, and 6 are the best measures of the other. This result could be taken as support for Cattell’s theory if the items in one cluster of tests seem to measure raw reasoning (fluid intelligence) and those in the other seem to measure learned information (crystallized intelligence).