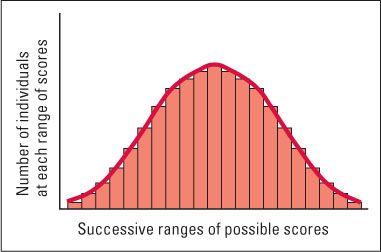
Figure 15.1: Typical distribution of scores measuring a personality trait When many individuals are tested for a personality trait—such as boldness versus shyness—the majority generally fall in the middle of the range and the frequency tapers off toward zero at the extremes, in a manner that approximates the bell-shaped normal distribution depicted here. (For a more complete description of normal distributions, see the Statistical Appendix at the end of the book.)