10.5 Genetic and Environmental Contributions to Intelligence
Although not everyone thinks that IQ is an adequate measure of intelligence, it would be hard to disagree that people exhibit substantial individual differences in intelligence. But what are the origins in these differences? Within psychology, researchers have often looked at two seemingly opposing contributions: nature (biology, genes) and nurture (learning, culture). As we saw in Chapter 3, the nature-nurture debate, which has persisted throughout psychology’s history in various guises, poses this question: Are psychological differences among people primarily the result of differences in their genes (nature) or in their environments (nurture)? The psychological differences that have been most often subjected to this debate are differences in personality (discussed in Chapter 15), in susceptibility to mental disorders (discussed in Chapter 16), and, especially, in intelligence as measured by IQ. As you will discover, the answer to the nature-nurture question concerning IQ is, it depends. It depends on just whose IQs you are comparing.
Nature, Nurture, and IQ Differences
25
What is the difference between the absurd form of the nature-nurture question and the reasonable form? Why is one absurd and the other reasonable?
A common misunderstanding is that the nature-nurture question has to do with the degree to which a particular trait, in an individual, results from genes or environment. Some might ask, for example, “Does a person’s intelligence result more from genes or from environment?” But if you think about that question, you will realize it is absurd. Without genes there would be no person and hence no intelligence, and without environment there would also be no person and no intelligence. Given that genes and environment are both essential for any trait to develop, it would be absurd to think that one contributes more than the other to the trait. But it is not absurd to ask whether differences in a trait among individuals result more from differences in their genes or in their environments. An alternative way of expressing the nature-nurture debate is how do nature and nurture interact to produce a particular pattern of development or of intelligence? As we saw in Chapter 3, genes are always expressed in an environment, and the effect those genes will have on any outcome, including intelligence, will differ depending on the environment in which they find themselves.
400
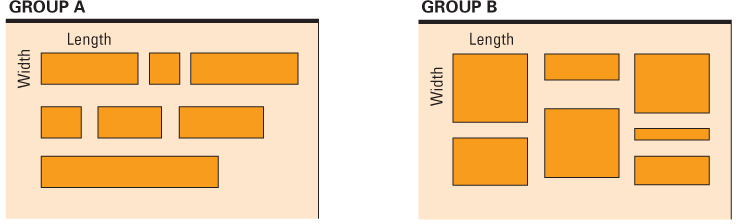
A useful analogy (suggested by Hebb, 1958a) concerns the contribution of length and width to the areas of rectangles. It is absurd to ask whether the area of any given rectangle results more from its length or its width because both dimensions are essential to the area. If you shrink either to zero, there is no rectangle and no area. But it is not absurd to ask whether the differences in area among a given set of rectangles result more from differences in their length or in their width. As illustrated in Figure 10.11, the answer could be length or it could be width, depending on the specific set of rectangles asked about.
Similarly, when we ask whether differences in intelligence derive primarily from differences in genes or in environment, the answer might be genes for one set of people and environment for another. Logic tells us, for example, that IQ differences are likely to result more from environmental differences if the people we are studying live in very diverse environments than if they live in similar environments. If you were raised in an ideal upper-middle-class home and I was raised in a dysfunctional low-income family, the difference between us in IQ would be attributable mostly to differences in our environments; but if we were both raised in typical middle-class environments, then whatever difference exists between us in IQ might result mostly from differences in our genes.
The Concept of Heritability
26
How is heritability defined? Why would we expect heritability to be higher in a population that shares a similar environment than in an environmentally diverse population?
The central concept in any modern scientific discussion of the nature-nurture question is heritability. Heritability is the degree to which variation in a particular trait, within a particular population of individuals, stems from genetic differences as opposed to environmental differences. Heritability is often quantified by a statistic called the heritability coefficient, which ranges from 0 (none of the differences in a trait are attributed to inheritance) to 1.0 (100 percent of the differences in a trait are attributed to inheritance). It reflects the proportion of differences in an observed trait that is due to genetic variability.
Heritability does not say anything about how much of any trait is due to genetic factors, only what percentage of the difference in a trait within a specific population can be attributed to inheritance, on average. As an example, assume that individual differences in weight are due to just two factors: inheritance (genetics) and diet (environment). Now assume that every person living in an isolated mountaintop community gets 100 percent of his or her nutritional needs. The average weight of men in this community is 150 pounds. If you meet two men from the community, one weighing 155 pounds and the other 160 pounds, 100 percent of their 5-pound difference would be due to genetics, and the heritability coefficient would be 1.0. This is because their diets are identical—no differences in environment exist—meaning that all differences must be attributed to genes.
401
But now assume that a famine hits this community, changing the number of calories people consume and thus the average weight (say from 150 to 140 pounds). If everyone experienced the same reduction of calories (say a 20 percent decrease), environments would still be identical and heritability would still be 1.0, despite the 10-pound difference in the population average. What would happen, however, if the dietary changes were not uniform among the mountaintop inhabitants—instead, some people received a greater percentage of their dietary needs (say 100 percent) than others (say 75 percent). The average population weight change may still be 10 pounds, but now some percentage of a 5-pound difference in weight between any two men would likely (on average) be due to environment, and thus heritability would be something less than 1.0. The more variable environments are between people in a population, the lower heritability will be. Heritability is thus relative, varying with the environmental conditions in which people within the population live.
Family Studies of the Heritability of Intelligence
How might one estimate heritability, given that there is no direct way to measure individual differences in genes or environments? The general answer is to compare groups of people who differ in their degree of genetic relationship to see how much they differ in the trait in question. To the degree that a trait is heritable, people who are closely related to each other genetically should be more similar to each other than are people who are related more distantly.
27
What is the logic of comparing identical and fraternal twins to study the heritability of traits? What difference is observed between identical and fraternal twins in IQ correlation, and how does that difference change as the pairs of twins get older?
A difficulty with using this logic, however, is that related people also typically share similar environments. Thus, the observation that siblings are, on average, more similar to each other in IQ than are unrelated people does not, by itself, tell us the degree to which their similarity results from similarities in their genes or in their environment. For this reason, many large-scale and tightly controlled studies of adoptees and twins have been conducted over the past half-century. Their findings are quite consistent and summarized in Figure 10.12 (Bouchard & McGue, 1981).
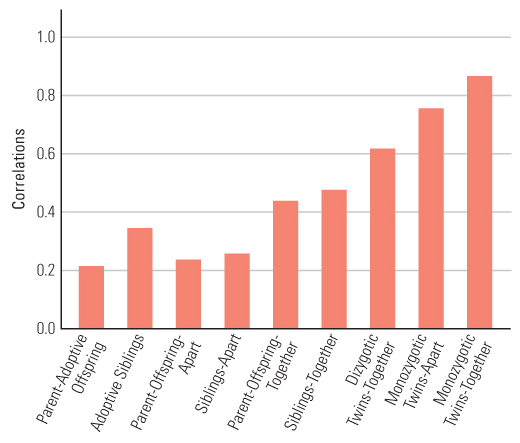
Note that in Figure 10.12 some correlations are between “family” members that either do not share genes (parents and adopted offspring; adoptive siblings), or between genetically related people who are not reared in the same home environment (siblings reared apart; parents and adopted-away offspring; identical twins reared apart). As you can imagine, twins are especially valuable subjects in such studies because some pairs of twins are genetically identical (monozygotic) and other pairs (fraternal twins; dizygotic) are, like nontwin siblings, only 50 percent genetically related. A common way to estimate the heritability of IQ is to compare the correlation in IQ scores of identical twins with that of fraternal twins.
402
28
How can IQ heritability be estimated using the correlation coefficients for the IQs of identical and fraternal twins raised together? Using this method, what is the evidence that IQ heritability is greater for adults than for children?
As explained in Chapter 2, correlation coefficients can run from 0.00 to either plus or minus 1.00. As you can see from the figure, correlations generally increase as genetic similarity increases, suggesting a significant role for genetics. Heritability estimates can be derived from these correlations. The easiest way to compute a heritability coefficient is by using data from twin studies. The correlation (denoted as r) based on data from nonidentical twins is subtracted from the correlation based on data from identical twins, and the difference is doubled, or,
Heritability = (r identical twins —r nonidentical twins) × 2.
The precise logic behind this method involves more mathematical detail than most readers would desire, but you can get a sense of that logic without the mathematics. The assumption is that the environment is equally similar for the two categories of twins, so the difference between the two in IQ correlation must stem from the difference in their degree of genetic relatedness; that is, the difference must reflect heritability. Because fraternal twins are themselves 50 percent genetically related, the difference between the two correlation coefficients is assumed to reflect only half the difference that would be observed if the comparison were between identical twins and completely unrelated individuals. Therefore, the difference is doubled to arrive at an estimate of the heritability coefficient.
Taking the correlations of the IQs of identical (monozygotic) twins reared together shown in Figure 10.12 (.86) and those of fraternal (dizygotic) twins reared together (.60), the resulting computation is H = (.86 − .60) × 2 = .52. This means that the heritability of intelligence (at least based on this data set) is .52, or that 52 percent of the difference in intelligence between people is attributed to genetics.
29
How can IQ heritability be estimated by studying identical twins who were adopted into different homes?
Another way to assess heritability of IQ is to study the IQ correlation of pairs of identical twins who were adopted at an early age into separate homes. On the assumption that the environments of raised-apart identical twins are no more similar to each other than are the environments of any two members of the study population chosen at random, the correlation coefficient for raised-apart identical twins is itself an estimate of the heritability coefficient (Loehlin et al., 1988). The average coefficient determined from many such studies is 0.73 (McGue et al., 1993; see Figure 10.12). So, using this method, the estimated heritability for IQ is 0.73. Most of the twin pairs in those studies were adults, but a few were adolescents, and no attempt was made to determine the coefficient separately for different age groups.
Every procedure for assessing heritability involves assumptions that may not be entirely true, so any heritability coefficient should be taken as only a rough estimate. But the studies suggest, overall, that genetic differences account for roughly 30 to 50 percent of the IQ variance among children and for considerably more than 50 percent of the IQ variance among adults in the populations that were studied (Davis et al., 2008; McGue et al., 1993).
30
How can a person’s rearing environment influence the heritability of IQ?
Heritability of IQ does not represent some biological feature of people that is impervious to experience. Rather, heritability estimates of IQ vary with environmental factors for people in the same population (Rowe et al., 1999; Turkheimer et al., 2003). For instance, in one study David Rowe and his colleagues (1999) gathered verbal IQ scores from 3,139 adolescent sibling pairs from economically diverse backgrounds. The sample included sets of monozygotic and dizygotic twins, and adopted siblings. Rowe and his colleagues reported that, for all the subjects, the heritability of verbal IQ was .57, similar to what other researchers have reported. Rowe and his colleagues next divided the sample into a high-education group (parents had greater than a high-school education) and a low-education group (parents had less than a high school education). The heritability for the high-education group jumped to .74, but decreased to .26 for the low-education group (see Turkheimer et al., 2003, for similar findings).
403

These results indicate that heritability increases with improved environmental conditions, here as reflected by level of parental education. According to Sandra Scarr (1992), this is because harmful environments (reflected in Rowe’s research by a low level of education for the adolescents’ parents) have an especially strong impact on the development of certain traits, whereas average or above-average environments will have little influence beyond that contributed by genetics.
Contrary to what might be expected, studies that have assessed fluid and crystallized intelligence separately indicate that the two are about equally heritable (Horn, 1985). Apparently, within the populations that have been studied, genetic differences influence the amount of factual knowledge that people have learned just as much as they influence people’s ability to think quickly or to see relationships in novel stimuli. It is not hard to think of many ways by which genetic differences could have such an effect. Genes can influence curiosity, reading ability, long-term memory, or any of countless other traits that influence the acquisition and recall of facts.
The Short-Lived Influence of Family Environment
31
What is the evidence that the effect of a shared family environment on IQ correlations is lost in adulthood? How might this loss be explained?
It seems reasonable to expect that the IQs of children raised in the same family would be more similar than average not just because of shared genes but also because of shared environments. After all, children in the same family are exposed to the same parents, the same neighborhoods, the same schools, and the same learning opportunities at home. But is this expectation correct?
The most direct way to assess the degree to which a shared family environment leads to similarity in IQ is to study pairs of adoptive siblings who are genetically unrelated but are raised together. Assuming that such pairs are genetically no more similar to each other than any two random people from the study population, any correlation greater than 0 in their IQs must stem from their shared environment. Several such studies have been done, and the results tell a remarkably consistent story. As long as the unrelated siblings are still children, their IQs do correlate positively with each other; but the correlation is lost completely by the time they reach adulthood.

Taking all such studies together, the average IQ correlation for genetically unrelated children living in the same family is 0.25, and the average for genetically unrelated adults who had been raised in the same family is −0.01, or essentially 0 (McGue et al., 1993). Other studies have shown that the IQ correlations for other categories of children raised in the same family also decline as the children enter adulthood, but the greater the degree of genetic relationship, the smaller the decline (Plomin & Daniels, 1987). Similarly, a meta-analysis of twin studies found that IQ correlation for fraternal twins declined at adulthood while that for identical twins did not (McGue et al., 1993). Apparently, families have a moderately strong early influence on children’s IQ, but the effect fades as the children become adults.
The transient nature of the effect of the family on IQ is perhaps the most surprising result that has emerged from studies of IQ correlations. Before such studies were done, many if not most psychologists believed that even subtle differences in the early environments of children would give some an advantage in intellectual development that would last a lifetime. But the research has shown quite conclusively that the advantage or disadvantage of being raised in a particular home, within the range of homes the researchers sampled, disappears by early adulthood.
404
One way to explain this finding is to assume that as children grow into adulthood, they increasingly choose their own environments, and their genetic differences influence the kinds of environments they choose (Dunn & Plomin, 1990; Scarr & McCartney, 1983). Those who are genetically similar, and therefore more similar in interests and temperament, may choose more similar environments than do those who are genetically different, and so they remain more similar in intelligence. If you think of intelligence as analogous to muscle strength, which can wax and wane depending on exercise, then you can understand why an adult’s IQ may be more influenced by his or her adult environment than by his or her past, childhood environment.
Effects of Personality and Life Experiences on Intelligence
32
What evidence suggests that intellectual involvement can increase a person’s fluid intelligence over time?
Intelligence is maintained and strengthened through active, intellectual engagement with the world. Not surprising, people who score high on a personality test designed to measure openness to experience have, on average, higher IQs than do those who score lower on that personality measure (Ackerman & Heggestad, 1997; Gignac et al., 2004). Openness to experience includes the characteristics of curiosity, independence of mind, and broad interests. Presumably, people who have these characteristics choose intellectually engaging styles of life, and that choice tends to raise their intelligence. Openness appears to correlate at least as strongly with measures of fluid intelligence as with measures of crystallized intelligence. Intellectual engagement apparently does not just increase one’s store of knowledge, but also increases one’s capacity for mental gymnastics.
More direct evidence that activities can alter intelligence is found in a long-term study, conducted by Melvin Kohn and Carmi Schooler, of the effects of men’s occupations on their intellectual development. Kohn and Schooler periodically tested a large sample of men, throughout their careers, with a test of intellectual flexibility. The test included a number of subtests that are quite similar to those found on standard IQ tests, and it was later shown to correlate strongly with fluid intelligence as measured by standard IQ tests (Kohn & Schooler, 1978; Schooler, 2001).

The most general finding was that the men’s intellectual flexibility tended to change when their job demands changed. When they were in jobs that required them to handle a great deal of information and make complex decisions, their intellectual flexibility increased over time. When they were in routine jobs that depended more on brawn and/or tolerance of drudgery, their intellectual flexibility decreased over time. In subsequent research, done with both men and women, Schooler and his colleagues found that engagement in intellectually challenging leisure-time activities, even without career change, can also increase intellectual flexibility (Schooler, 2007; Schooler & Mulatu, 2001). These effects—both of occupation and of leisure-time activities—were greater for older adults (age 58 and older) than for younger adults (Schooler, 2001, 2007).
Here, again, the analogy between mental strength and physical strength seems to hold. Young people can maintain relatively strong muscles without much exercise, but as we get older our muscles begin to atrophy unless we increase their use. The same, apparently, is true for brain power.
Origins of IQ Differences Between Cultural Groups
The conclusions about the high heritability of IQ discussed so far in this chapter were properly qualified by the phrase “for the population that was studied.” In almost all cases that population was white, North American or European, and in the upper two-thirds of the socioeconomic scale (Stoolmiller, 1999). Heritability coefficients are always limited to the population that was studied. The more uniform the environment of that population, the smaller is the proportion of IQ variance that stems from environmental variation and the greater is the heritability coefficient (look back at the formula on p. 402). If heritability studies included people occupying the entire range of human environments rather than just a slice of that range, the resultant heritability coefficients would be smaller than those presented earlier.
405
Comparisons of racial or cultural groups routinely reveal average differences in IQ. The difference that has attracted the most attention, and on which we will focus here, is that between blacks and whites in the United States: Blacks, on average, score about 12 points lower than whites on standard IQ tests (Dickens & Flynn, 2006). The question is why. Some people who have heard of the heritability studies that you have just read about assume that those studies can be applied to understand the black-white difference. They assume that if IQ is highly heritable within a group, then any IQ difference between two groups must also be largely the result of genetic differences. But that assumption is false.
Why Within-Group Heritability Coefficients Can’t Be Applied to Between-Group Differences
33
Why can’t heritability coefficients found within groups be used to infer the source of differences between groups?
The heritability of a trait within a group, in fact, tells us nothing about differences between groups. To understand why, consider the example illustrated in Figure 10.13. Imagine two wheat fields, each planted from the same package of genetically diverse wheat seeds. Imagine further that the soil fertility is relatively constant within each field but quite different between the two—one has richer topsoil than the other. Within either field, differences in the sizes of individual plants would be the result primarily of genetic differences in the seeds, yet the average difference between the two fields would almost certainly be due entirely to the difference in the environment (the richness of the soil).

406
To take another example, height in people is more than 90 percent heritable when measured for a given cultural group, yet group differences in height can be found that are clearly the result of the environment (Ceci, 1996). In the 1950s, for example, researchers found that men of full Japanese ancestry born in California were nearly 3 inches taller, on average, than Japanese men born in Japan (Greulich, 1957). That difference almost certainly resulted from differences in diet between the two groups during their childhoods. (Read again the hypothetical example about the heritability of weight we gave on pp. 400-401.)
Evidence That Black-White IQ Differences Are Cultural in Origin
In the examples just given, we could be quite certain that the group differences were environmental in origin because there was reason to believe that the members of the two groups (of wheat plants and of Japanese men) did not differ genetically, on average. In contrast, many people automatically think of differences between the so-called black and white “races” as racial differences, and they automatically assume that racial means “genetic.”
In the United States and many other countries, however, blacks and whites are not truly distinct races in a biological sense but, rather, are different cultural groups. We generally classify people as “black” who have any detectable black African ancestry, no matter how small a proportion it is. Thus, a person who is half English, one-fourth French, and one-fourth African is called “black,” whereas that person’s cousin, who is half English, one-fourth French, and one-fourth Polish, is called “white.” While some average genetic differences exist between the two groups—which show up in skin pigmentation, for example—the amount of genetic variation within each group is far greater than the average difference between them.
34
What evidence suggests that the average IQ difference between black and white Americans derives from the environment, not genes?
Researchers who have attempted to separate the effect of black African ancestry from the effect of the social designation “black” have consistently failed to find evidence that genetic ancestry plays a role in the black-white IQ difference. In the first such study, Paul Witty and Martin Jenkins (1935) attempted to determine if high-IQ black children have more European and less African ancestry than blacks who have lower IQs. They identified a sample of black children in Chicago who had IQs in the superior range (125 or better) and then interviewed their parents to see if they had more European ancestry than the average black person. The results were negative: The proportion of European ancestry in the high-IQ black children was neither more nor less than that in the black population at large. (The highest IQ of all in that study, incidentally, was a whopping 200 scored by a girl with 100 percent black African ancestry.) Later, other researchers have performed similar studies, using biochemical methods to determine the degree of black African and other ancestry (Loehlin et al., 1973; Scarr & Carter-Saltzman, 1983). Like Witty and Jenkins, they found no relationship between ancestry and IQ, and they concluded that the social designation of black or white, not biological ancestry, is most likely the critical variable in determining the black-white IQ difference.
There are a number of reasons why blacks score lower than whites on IQ tests. For example, many researchers have suggested that IQ tests are biased, based on skills and knowledge deemed important by the majority culture, but perhaps not the minority culture. Many have argued that intelligence can only be meaningfully assessed within the culture in which a child lives making contrasts of IQ scores of people with different cultural experiences inappropriate (Laboratory of Comparative Human Cognition, 1983; Miller-Jones, 1989). Consistent with this, IQ differences between minority and majority children are reduced when “culture fair” tests such as the nonverbal Raven’s Progressive Matrices Test mentioned earlier are used (Anastasi, 1988).
407
35
What is stereotype threat, and how does it explain differences in IQ between white and black Americans?
Another source of differences in IQ scores between blacks and whites is related to stereotype threat (Steele, 1997). When people are made aware of negative stereotypes for their particular social group, such as the stereotypical belief that blacks perform poorly on tests of intelligence, they tend to confirm them. For example, when groups of African and European American college students were administered a test of verbal intelligence, the African American students scored significantly lower when they were told they were taking an intelligence test than when they were told the test did not assess people’s intelligence. In contrast, the scores of the European American students did not differ between the two conditions (Steele & Aronson, 1995). Although the stereotype threat does not eliminate the black-white IQ difference (Sackett et al., 2004), its presence suggests that IQ tests may be assessing not just people’s intelligence, but also people’s tendency to “choke” under situations in which a stereotype threat was activated.
Different Types of Minority Status Can Have Different Effects on IQ
36
What evidence suggests that the status of being an involuntary minority may be particularly detrimental to IQ development?
How might the social designation of black or white affect IQ? Nobody knows for sure, but John Ogbu (1986; Ogbu & Stern, 2001) suggested an interesting line of thought about it. On the basis of cross-cultural research, Ogbu distinguished between voluntary minorities and involuntary or castelike minorities. Voluntary minorities are groups, such as Italian Americans and Chinese Americans, who emigrated in hopes of bettering themselves, who typically see themselves as well off compared with those they left behind, and who see themselves as on their way up, regardless of how the dominant majority may see them. Involuntary minorities are groups, such as African Americans and Native Americans, who became minorities through being conquered, colonized, or enslaved. They are people who for long periods were, and in many ways still are, treated as if they are a separate, inferior class. According to research summarized by Ogbu, involuntary minorities everywhere perform more poorly in school, and score an average of 10 to 15 points lower on IQ tests, than the dominant majority.
Particularly informative, in Ogbu’s work, is the comparison of the Buraku outcasts of Japan with blacks of the United States. The Buraku, who are a purely cultural class, not racially distinct from other Japanese, were emancipated from official outcast status by a royal edict in 1871, just 8 years after blacks in the United States were emancipated from slavery; yet, both groups, to this day, often occupy menial positions and are implicitly, if not explicitly, perceived as inferior by many members of the dominant majority. The gap in school achievement and IQ between the Buraku and the majority group in Japan is about the same as that between blacks and whites in the United States—but the gap disappears when Buraku move to the United States. Most people in the United States do not know the difference between Buraku and other Japanese, and the two groups of immigrants are treated the same and perform equally well in school and on IQ tests. According to Ogbu, it is the sense that one is an outcast, and that standard routes to achievement are cut off, that oppresses castelike minorities and depresses their scholastic achievements and IQs.
The Historical Increase in IQ
37
How does history provide further evidence that IQ is highly susceptible to cultural influence? On which measures has IQ increased the most?
Perhaps the most dramatic evidence of cultural influence on intelligence is the improved performance on IQ tests that has been observed worldwide over the years since they were invented. As you know, IQ tests are literally graded on a curve (a bell curve, to be exact), with the average score for the population at any given time in history assigned a value of 100. But the average score keeps rising, indicating that the tests become easier for each successive generation, so researchers periodically modify the scoring system and increase the difficulty of the questions.

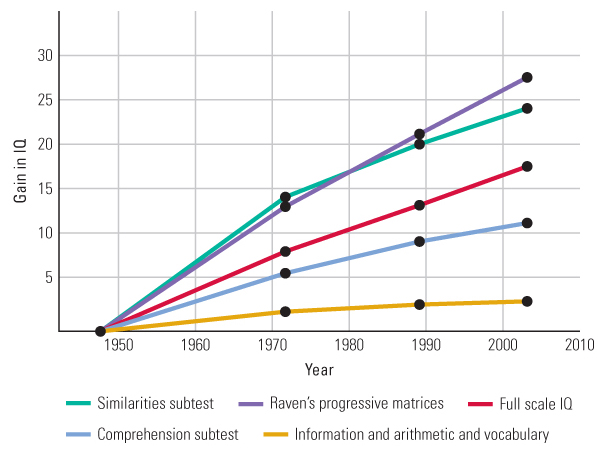
James Flynn (1987, 2007, 2012) has compiled data on norm adjustments for many different countries, from the dawn of IQ testing to the present, and has found that the increase in IQ has occurred at a rather steady rate of about 9 to 15 points every 30 years, depending on the type of test. This so-called Flynn effect has occurred for people of all races and ethnicities and has occurred in countries as varied as the United States, Belgium, Argentina, and Kenya (Daley et al., 2003; Flynn, 2003). The greatest increases, interestingly, are in the tests geared toward fluid intelligence, such as Raven’s Progressive Matrices—the very tests that were originally conceived of as least affected by cultural experience and most indicative of raw reasoning ability.
408
As an example, Figure 10.14 illustrates the gains in IQ scores that would have occurred in the United States between 1948 and 2002 if the tests and scoring system had not been periodically adjusted. The graph depicts data for various subtests of a standard IQ test (the WISC), for the full-scale IQ score, and for Raven’s Progressive Matrices. Notice that the biggest gains are for Raven’s Matrices and the Similarities subtest of the WISC, both of which are deemed to be excellent measures of fluid intelligence. (In the Similarities subtest, the person is presented on each trial with the names of two common objects or events, such as mouse and crow, and has to say what is similar about them; a correct answer might be that they are both animals.)
409
38
How might the historical increase in fluid intelligence scores be explained?
What accounts for these massive gains in IQ from one generation to the next? Flynn (2007, 2012) argues that the increase is due mainly to changes in modern life. Improvements in education, greater use of technology, and more people being engaged in intellectually demanding work has lead to a greater proportion of people with experience manipulating abstract concepts than was the case in decades past, and this, in turn, is responsible for elevated IQ scores for people of all ages.
In today’s world—partly because of television, computers, and other such technology—we are constantly being presented with new ideas, new information, new problems to solve. Fluid IQ tests require us to answer questions or solve problems on the spot, based upon information that we have just been given. In today’s world, that is something that we do all the time, so we have become good at it.
Even television, so often disparaged as intellectually stifling, may promote the kind of thinking that leads to good performance on fluid IQ tests. As Steven Johnson (2005) has demonstrated with quantitative analyses, television programs have, over time, grown immensely in complexity and pace. Programs that have been popular relatively recently—such as The Sopranos, NCIS, and 24—require viewers to keep many subplots and different characters in mind and to shift mental set frequently as the action jumps quickly from one time and place to another and the dialogue provides only hints about what is going on. Compare that to, say, the 1950s show I Love Lucy (which, as of this writing, could still be seen on the Hallmark Channel). Moreover, as we pointed out in Chapter 9, fast-paced video games exercise attention and working-memory capacity, which are the aspects of mind that contribute most to measures of fluid intelligence. We aren’t necessarily any better than our grandparents were at solving real-world problems, but we are definitely better at the game-like problems that make up the fluid components of IQ tests.
SECTION REVIEW
Nature-nurture questions about intelligence have no simple answers.
IQ Differences Within a Cultural Group
- The reasonable version of the nature-nurture question asks whether genetic or environmental variation contributes more to observed IQ variation within a population.
- Heritability is the extent to which variation in a trait (for example, IQ), within a particular population, derives from genetic differences among the individuals.
- Twin studies have shown that, within a population, genetic variation accounts for about half of IQ variance in children and for more than that in adults.
- Effects of the shared family environment (aspects of the environment shared by children growing up in the same home) on IQ are temporary; they disappear in adulthood.
- There is evidence that a person’s job or leisure activities can alter his or her fluid intelligence.
IQ Differences Between Cultural Groups
- Heritability coefficients for IQ within groups cannot be legitimately used to explain the source of average IQ differences between groups (for example, racial or cultural groups).
- The average black-white IQ difference found in the United States is related to the social designation of black or white rather than to the degree of African or European ancestry.
- Involuntary minority status is particularly likely to reduce a group’s IQ.
- The large historical gains in IQ—perhaps resulting from changes in technology—also demonstrate the influence of cultural factors.
410