FIGURE 10.1b
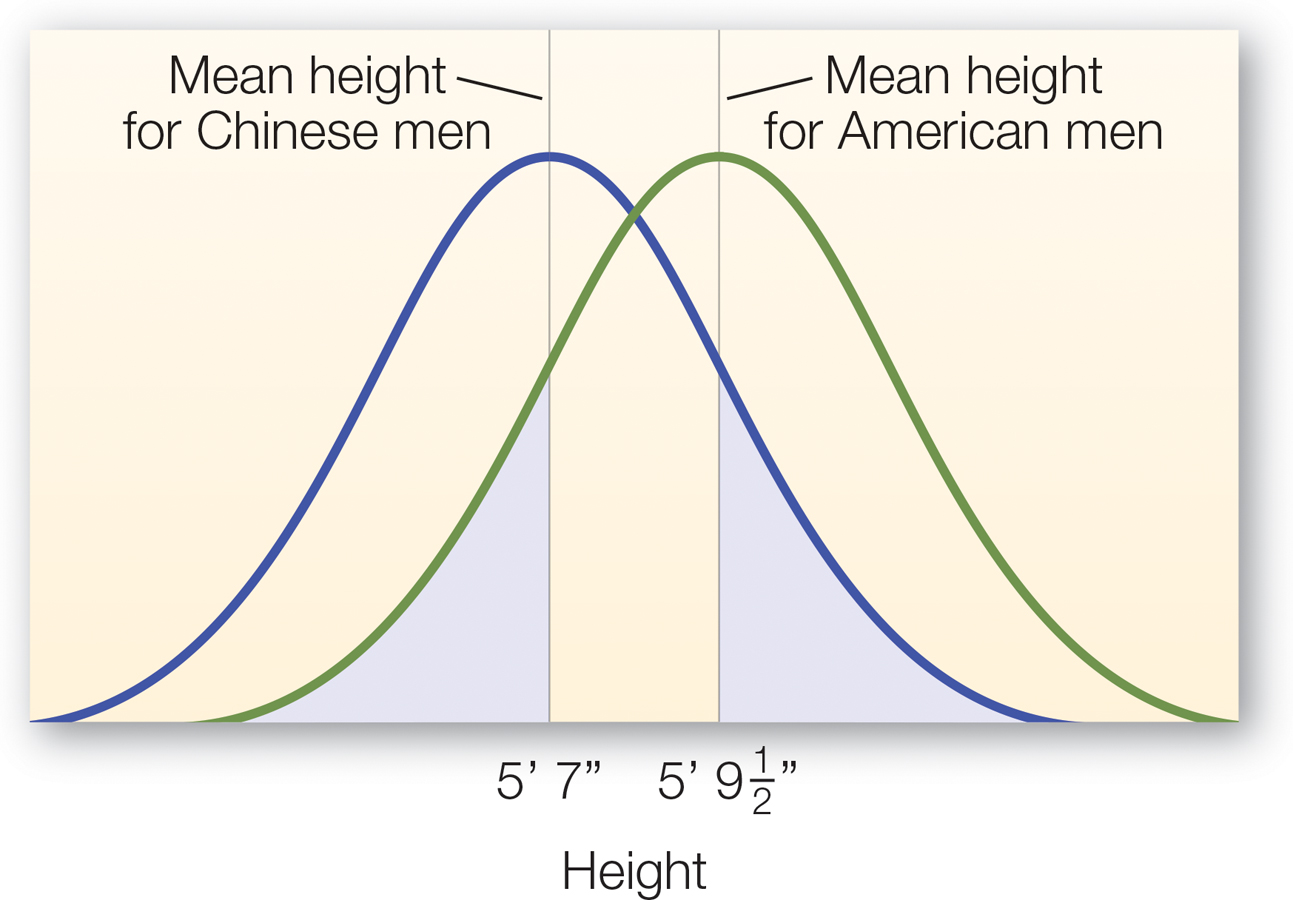
Overlapping Normal Distributions of Two Groups With Different Mean Heights
The normal distribution of Chinese and American males’ heights, based on the group means, might look something like this. The shaded areas represent cases in which we would be wrong if we simply assumed that American males are taller than the average Chinese male or that Chinese males are shorter than the average American male.