How We See and How We Hear
Our two most dominant senses are vision and hearing. This section will first discuss how our eyes and ears gather and process information from the environment. Visual and auditory stimuli are physical energies in the form of waves—light waves and sound waves. We need to understand the characteristics of these waveforms to understand how visual and auditory stimuli are processed, so we need to discuss them first. A typical waveform and its primary characteristics (wavelength, frequency, and amplitude) are illustrated in Figure 3.3.
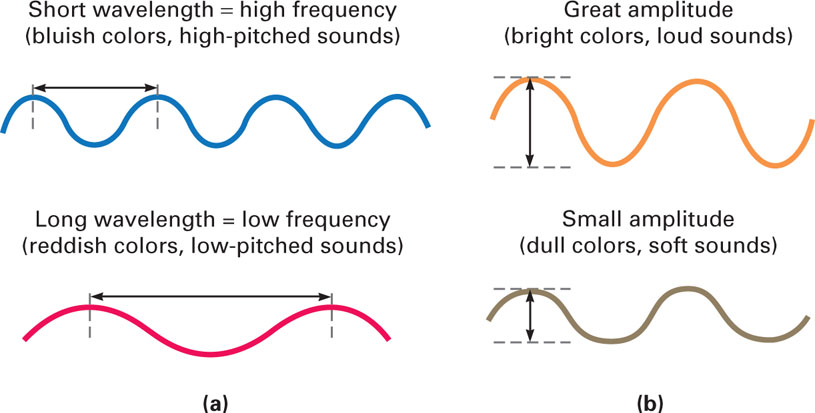
Wavelength refers to the distance in one cycle of a wave, from one crest to the next. Different wavelengths of light lead to varying perceptions of color. Humans can perceive wavelengths roughly from 400 to 700 nanometers (nm), or billionths of a meter. As the wavelengths decrease from 700 nm, the resulting hues go from red through the colors of the spectrum down to violet. One way to remember the order of these colors is by remembering the name ROY G. BIV, which stands for Red, Orange, Yellow, Green, Blue, Indigo, and Violet. Amplitude refers to the amount of energy in a wave, its intensity, which is the height of the wave at its crest. For light waves, the amplitude determines the brightness of the light. Different amplitudes lead to different levels of brightness; the greater the amplitude, the brighter the light.
105
For auditory stimuli, the frequency of the waveform rather than its length is used. Frequency refers to the number of times the waveform cycles in one second. Longer wavelengths have lower frequencies, and shorter wavelengths have higher frequencies. The frequency of a sound wave determines its pitch, the quality of sound that we describe as high or low. For example, female voices usually have a higher pitch than male voices. Humans can perceive sound wave frequencies from about 20 to 20,000 hertz (Hz), the number of cycles of the sound wave in one second. This unit of measurement’s name, hertz, comes from a nineteenth-century German physicist named Heinrich Hertz, who studied sound. The amplitude of a sound wave corresponds to our perception of its loudness. As the amplitude of a wave increases, its perceived loudness increases.
The brain cannot process physical energies such as light waves and sound waves. There are receptor cells in our eyes and ears that specialize in transduction—converting physical energy into neural signals that the brain can understand. This conversion is the first step in processing incoming sensory information. Following transduction, the incoming visual and auditory signals undergo further processing on their way to the brain, and within the brain before we see and hear the brain’s interpretations of these signals. Next, we will take a closer look at transduction and the initial information processing in the eyes and ears, focusing on how we see color and how we distinguish the pitches of sounds.
How the Eye Works
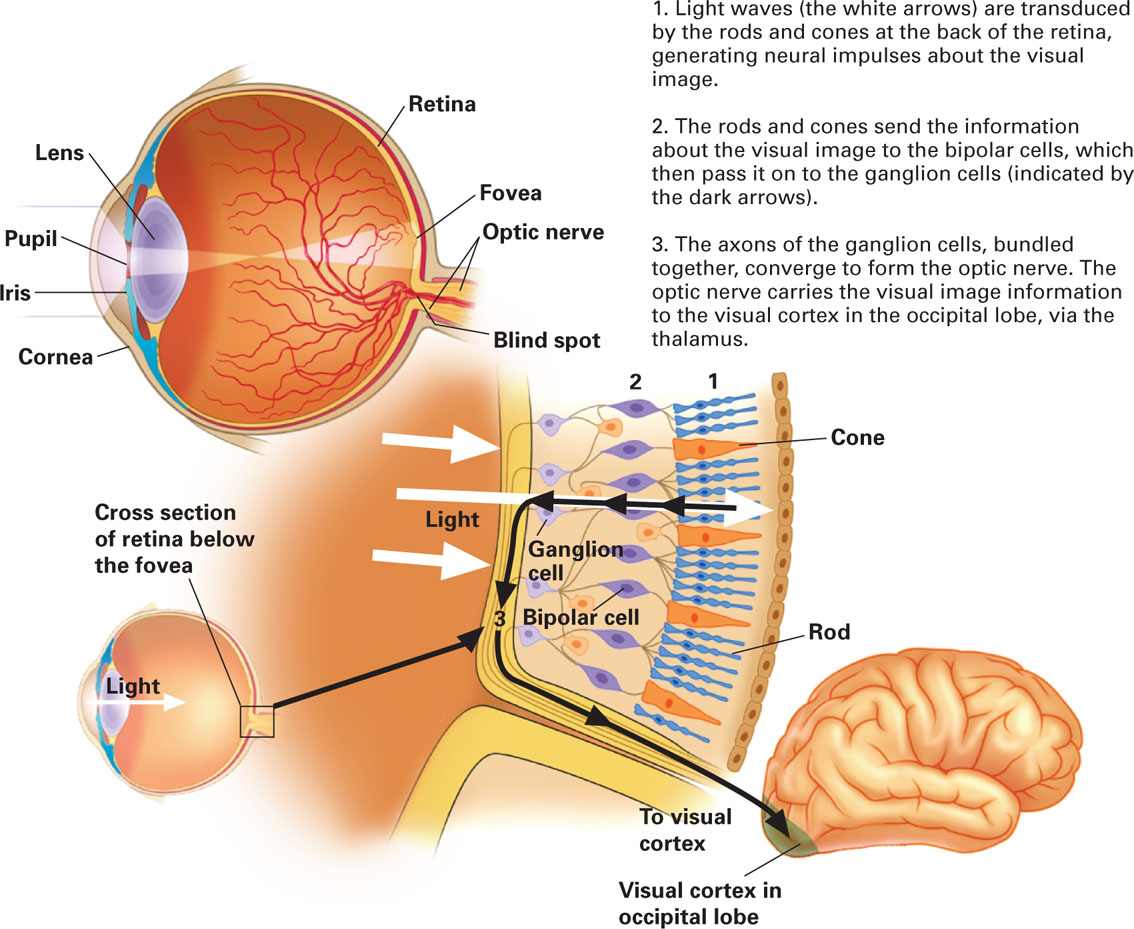
The light-sensitive receptor cells are located in the retina at the very back of the eye; therefore, light waves have to travel through almost the entire eye before transduction occurs. Figure 3.4 shows the path of the light and each of the parts of the eye that we will discuss. The cornea is the clear, tough covering on the front of the eye that starts bending the light waves that will eventually have to be focused on the retina. The light waves pass through the cornea and the pupil, a tiny hole through which the light waves enter the eye. The iris is a colored muscle that both gives eyes their color and controls the size of the pupil, which determines how much light enters. To lessen the amount of entering light, the iris will constrict (lessen) the size of the pupil, and to increase the amount of entering light, it will dilate (increase) the pupil’s size. A completely dilated pupil lets in about 16 times as much light as one that is completely constricted (Matlin & Foley, 1997).
106
107
The light then passes through the transparent lens, which is responsible for accommodation—the focusing of the light waves from objects of different distances directly on the retina. This process is called accommodation because the lens changes its shape (accommodates) in order to focus objects at different distances. When looking at distant objects (at least 20 feet away), the lens is in its unaccommodated flattest state, which allows the light waves to be focused on the retina. When we look at objects that are nearer, the lens accommodates by becoming thicker in order to focus the light waves properly on the retina. Because light travels in straight lines, the retinal image will be inverted and reversed. The brain, however, rearranges this image to its correct orientation for our perception.
If the image is not properly focused on the retina because of defects in the lens or the shape of the eyeball, problems in vision arise. Nearsightedness occurs when the light waves from distant objects come into focus in front of the retina, which blurs the images of these objects. Farsightedness is created by the opposite focusing problem—light waves from nearby objects come into focus behind the retina, resulting in blurred images. So, in nearsightedness, we have difficulty viewing distant objects, but can see near objects well; in farsightedness, we have difficulty viewing near objects, but can see far objects well. Farsightedness is similar to what happens to our vision as we age; the lens loses its ability to accommodate for nearby objects. Older people find it difficult to focus on near objects, so they have to get reading glasses and hold objects at a distance to help in seeing them.
It is also important to realize that our brains do not process everything in the physical world but rather only a tiny bit of it. For example, the part of the light spectrum that is visible to us is less than a ten-trillionth of it (Eagleman, 2011). We have no awareness of the rest of the spectrum carrying X-rays, radio signals, gamma rays, and so on. No matter how hard you try, your senses are not equipped to tune into the rest of the spectrum. There is far more out there than meets the eye.
The structure of the retina.
Except for the visual image being reversed and inverted, no visual processing occurs until the light waves reach the retina, which is only a mere half-millimeter thick (Brynie, 2009). As shown in Figure 3.4, the retina, the light-sensitive layer of the eye, is composed of three layers of cells—ganglion, bipolar, and receptor (the rods and cones). The light waves pass through the ganglion and bipolar cells before reaching the rods and cones, where visual processing begins. The light waves are absorbed by photopigments (light-sensitive chemicals) within these receptor cells, creating patterns of neural impulses that describe the visual image. This neural information is conveyed to the bipolar cells, which in turn send it along to the ganglion cells. The optic nerve, the axons of the ganglion cells bundled together, exits the eye carrying the information along the visual pathways to the brain. Where the optic nerve exits each eye, we have a blind spot—a retinal area with no receptor cells, preventing us from seeing anything there. To experience the blind spots in each of your eyes, follow the instructions in Figure 3.5. Why don’t we normally notice the blind spot in each eye? The brain fills them in by using top-down processing, which we will discuss in the next section (Churchland & Ramachandran, 1996).

108
The optic nerve carries the visual information to the thalamus, which is responsible for directing it to the primary visual cortex in our occipital lobes to be processed. But how does the visual cortex interpret this message from the retina? David Hubel and Torsten Wiesel’s innovative research in which they recorded patterns of electrical impulses in individual neurons in the visual cortex of cats provided the answer. They were awarded the Nobel Prize in Physiology or Medicine in 1981 for their discoveries concerning information processing in the visual system. The story of their collaboration along with reprints of all of their key publications can be found in Hubel and Wiesel’s Brain and visual perception: The story of a 25-year collaboration (2004). Because this cortical processing is very involved, we’ll just describe the general nature of this very counterintuitive processing.
Essentially, the brain recognizes a visual object (a process called pattern recognition) by breaking it down into its elementary features, such as angles and diagonal lines. Cortical cells called feature detectors then recognize these elementary features. Finally, the elementary features are put back together again, so that the whole object can be recognized. For example, to recognize Δ, it is broken down into its features (possibly,/, —, and \), which are recognized and then regrouped into the proper relationship. Strange isn’t it? To recognize an object, the object is broken down into its parts and then put back together again in order to identify it. Even stranger is that there are separate processing systems for form, color, distance, and motion information, which the brain somehow coordinates and unifies into our seamless perception of the world (Ratey, 2001).
109
But what if your primary visual cortex were severely damaged? You would be blind in the conventional sense, but you might possibly have what is called blindsight (seeing without knowing)—a condition in which a blind person has some spared visual capacities in the absence of any visual awareness (Weiskrantz, 2009). The oxymoron blindsight was coined by Lawrence Weiskrantz of Oxford University, who has studied this condition for more than 40 years (Weiskrantz, Warrington, Sanders, & Marshall, 1974). People with blindsight respond to a visual stimulus without consciously experiencing it. For example, they claim that they do not see an object, but when asked to reach out and touch it, they can do so far more often than what chance would predict. If you put a large object in their path, they will walk around it but insist that they do not see anything. The experimental evidence concerning blindsight has sometimes been controversial (Cowey, 2010), and the explanation for blindsight remains unsettled. Some researchers believe that the blindsight responses stem from the flow of visual information through neural pathways that bypass the damaged visual cortex (a kind of information detour) to brain areas that do not convey the conscious perception but enable the blindsight responses (Ptito & Leh, 2007; Schmid et al., 2010). An alternative explanation is that a small amount of healthy tissue remains within the damaged visual cortex, not enough to provide conscious perception but sufficient for blindsight responses (Gazzaniga, Fendrich, & Wesainger, 1994). It is also possible that both hypotheses are correct. Because there is much variability between those with blindsight, each hypothesis might explain different cases. One conclusion that can be made, however, is that normal visual perception requires a healthy visual cortex.
Rods and cones.
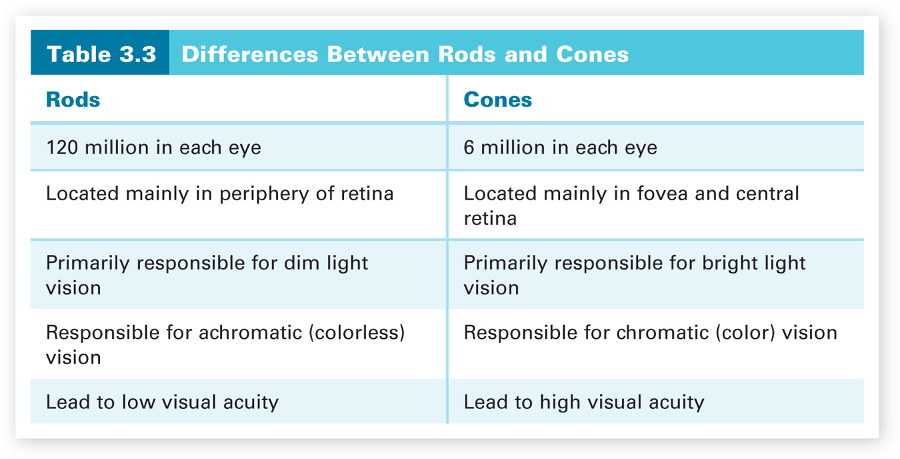
There are two types of visual receptor cells, rods and cones, in the retina. They are called rods and cones because of their actual physical shapes. Their functions are also very different. Rods are principally responsible for dim light and achromatic (colorless) vision, and cones for bright light and color vision. Rods outnumber cones about 20 to 1 (Kalat, 2007). There are about 120 million rods and only 6 million or so cones in each eye. Cones are more centrally located in the retina than rods. They are located in the fovea, a tiny pit in the center of the retina, and in the periphery of the retina on each side of the fovea. Rods are only located in the periphery, and the proportion of rods to cones increases with increasing distance from the fovea. The major differences between rods and cones are summarized in Table 3.3.
110
The difference in location of rods (peripheral) and cones (central) helps us to determine where we should focus an object for the best visual acuity (resolution of detail). In normal or brighter light when the cones are mainly responsible for our vision, the object should be focused on the fovea, which is packed with cones. Cones provide a clearer picture of an object. Why? Cones, especially foveal cones, tend to have more direct routes than the rods to the bipolar and ganglion cells for the retinal information that they process. For example, typically one foveal cone communicates with one bipolar cell, but several rods communicate with one bipolar cell. This means that the information that the rods send forward has been averaged across several retinal positions, leading to a less clear picture of the retinal image. Foveal cones do not have to do such averaging; therefore, the retinal image they send forward is more detailed and clearer. The cones in the periphery just outside of the fovea do some averaging but far less than the rods.
But where should we focus an object in dim light conditions? The answer is in the periphery of the retina rather than the fovea. Why? This is where the rods are more densely located, and they are mainly responsible for our vision when not much light is available. We shouldn’t look directly at the object when there isn’t much light, but rather focus a little to the side of it so that it will be projected onto the periphery of the retina. The image won’t be as clear as when we can use our cones, but it is the best we can do in dim light. The major role of the rods in dim light vision is also apparent in dark adaptation, the process by which the rods and cones through internal chemical changes become more and more sensitive to light in dim light conditions. The cones adapt quickly (in 5 to 10 minutes), but need more light to function, so they do not really help us to see in dim light. It takes longer for the rods to adapt (20 minutes or so), but they slowly help us to see in dim light. Normally, however, we have enough light for our cones to be working. That is why we see the world in vivid color. But how do the cones do this, and what else is involved in producing our perception of color? These are the questions we discuss next.
111
How We See Color
How many different colors can humans discriminate? Hundreds? Thousands? These estimates are not even close. It has been estimated that the human eye can discriminate about 7.5 million different colors (Fineman, 1996). How can we differentiate so many colors? Actually our color vision can be explained by combining two rather simple theories of color vision, the trichromatic theory and the opponent-process theory. We will consider each one separately and then how the two work together to explain color vision.
Trichromatic theory of color vision.
Trichromatic theory, as the word trichromatic implies, proposes that there are three colors involved. Trichromatic theory assumes that there are three types of cones, activated best by short, medium, or long wavelengths of light, roughly corresponding to blue, green, and red. Indeed, research indicates that there are three types of cones, each containing a slightly different photopigment that is maximally sensitive to blue, green, or red wavelengths of light (Wald, 1964). The trichromatic theory assumes that all of the many colors that we can perceive are mixtures of various proportions of these three cone activities. If all three types of cones are equally active, we see white (the sum of the three wavelengths of light). Trichromatic theory played a role in the creation of the television screen, which consists of microscopic red, green, and blue dots. The colors we see on the screen are the product of how these three types of dots are activated by the television broadcast and how the light-emitting dots activate our three types of cones.
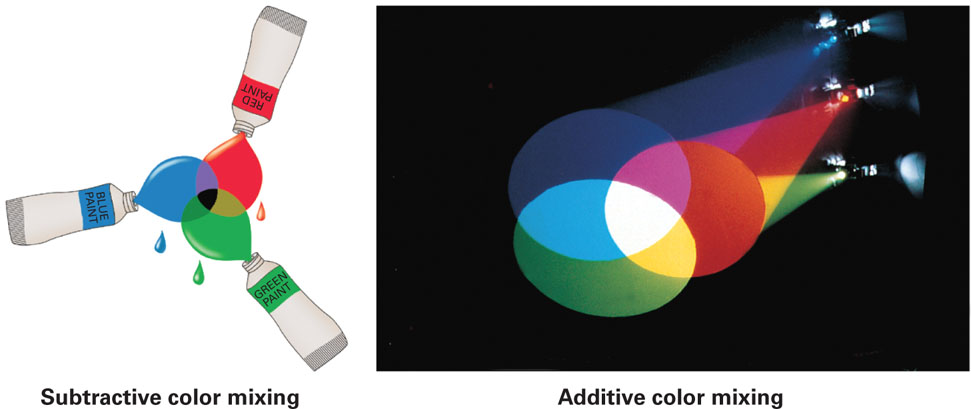
It is important to realize that the proposed mixtures of the primary colors are additive mixtures—different wavelengths of light are directly mixed together. In additive mixtures, all of the wavelengths of light reach the retina and are added together. The resulting colors are very different than those for subtractive mixtures, such as mixing paints. In subtractive mixtures, some wavelengths are absorbed (subtracted) and so do not get reflected from the mixture to the retina. For example, if we mix red, green, and blue paints together in equal amounts, the result is black (no light reflected). A mixture of equal proportions of red, green, and blue wavelengths of light, however, appears white. These subtractive and additive mixtures are shown in Figure 3.6.
112
There are color phenomena that trichromatic theory has difficulty explaining. We know that red-green and blue-yellow are pairs of complementary colors, wavelengths that when added together produce white. This means we cannot produce an additive mixture that is perceived to be reddish-green or a bluish-yellow. Trichromatic theory can’t explain why such colors can’t be produced if every color is an additive mixture of the three primary colors. In addition, this theory has difficulty explaining how we see complementary-color afterimages. For example, if we stare at a solid red square for a while and then look at a white sheet of paper, we will see a solid green square. Why?
Opponent-process theory of color vision.
To explain such phenomena, researchers developed a second theory, the opponent-process theory (Hurvich & Jameson, 1957). The opponent-process theory assumes that there are three opponent-process cell systems helping us to see color and that they are located at the post-receptor level of processing (after cone processing), which would mean along the visual pathways from the bipolar cells to the brain. The systems are the pairs, red-green and blue-yellow, plus a black-white (levels-of-brightness) system. The colors within each system oppose each other—if one is stimulated, the other one is inhibited. For example, there are blue-yellow opponent-process cells stimulated by blue light and inhibited by yellow light, and others that are stimulated by yellow and inhibited by blue. Researchers have found that some ganglion cells as well as some cells in the thalamus and visual cortex respond in accordance with opponent-process theory (DeValois & DeValois, 1975; Engel, 1999; Gegenfurtner & Kiper, 2003). Thus, we know that such cell systems exist.
113
Opponent-process theory can easily explain why we can’t see a reddish-green or a bluish-yellow. The complementary colors involved in each case cannot both be simultaneously stimulated. They cancel each other out. The theory can also explain complementary color afterimages. When you stare at one of the two colors in an opponent-process system for awhile, the part of that system responsible for processing this color gets fatigued and has to stop and recover. This is why we see the complementary color in the system when we look at a white surface—the other color is recovering and cannot oppose it. A good example is the American red, white, and blue flag. If we stare at a picture of this flag for a while and then switch our attention to a white sheet of paper, we see a complementary green, black, and yellow flag! If you stare at the green, black, and yellow flag in Figure 3.7 for about 40 seconds and then look at the white space next to it, what do you see?

114
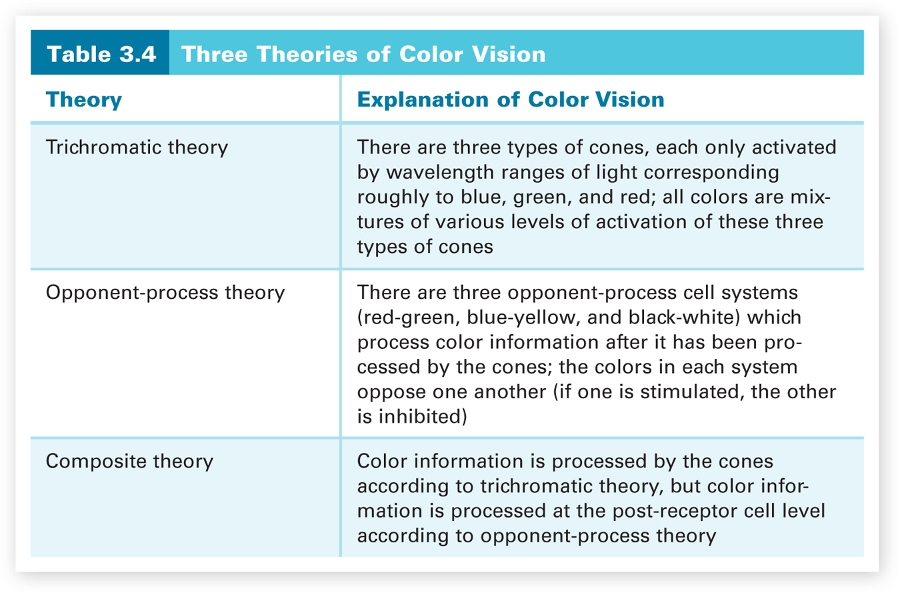
There is research that supports both trichromatic theory and opponent-process theory, so the best explanation for how we see color involves both theories, but at different locations in the visual pathways (Boynton, 1988). Color information is processed by the cones according to trichromatic theory, but color information is processed at the post-receptor cell level (by bipolar, ganglion, thalamic, and cortical cells) according to the opponent-process theory. This simple composite theory is a good example of competing theories becoming complementary theories. All three theories of color vision are summarized in Table 3.4.
This brief discussion of how we see color shows how visual input from the environment is processed, analyzed, and reconfigured, starting with its initial processing in the retina and as it continues along the visual pathways to the brain to be interpreted. Next, we will consider how such processing of auditory information enables us to hear.
How the Ear Works
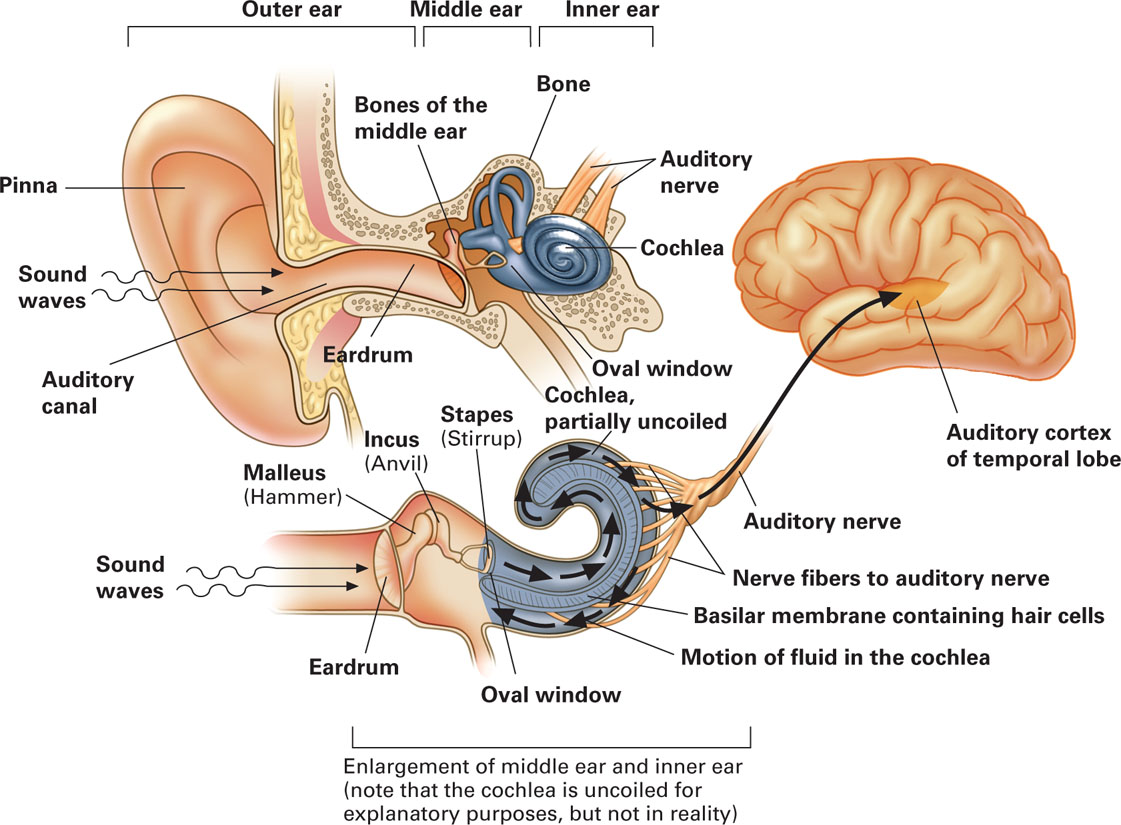
The auditory sensory system is a mechanical (vibratory) system with the receptor cells located in the inner portion of each ear. As you can see in Figure 3.8, the ear is divided into three sections—the outer ear, middle ear, and inner ear. The parts of each section are also shown in Figure 3.8. The pinna, the external part of the ear, collects sounds and funnels them through the auditory canal to the tympanic membrane (the eardrum), which marks the boundary between the outer ear and middle ear. The sound waves produce vibrations in the eardrum, and these vibrations create a chain reaction that moves the malleus, incus, and stapes (more commonly referred to as the hammer, anvil, and stirrup given their shapes), the three tiny bones in the middle ear (the three smallest bones in the human body). The movement of the stapes creates vibrations of the oval window, a membrane covering an opening into the inner ear.
115
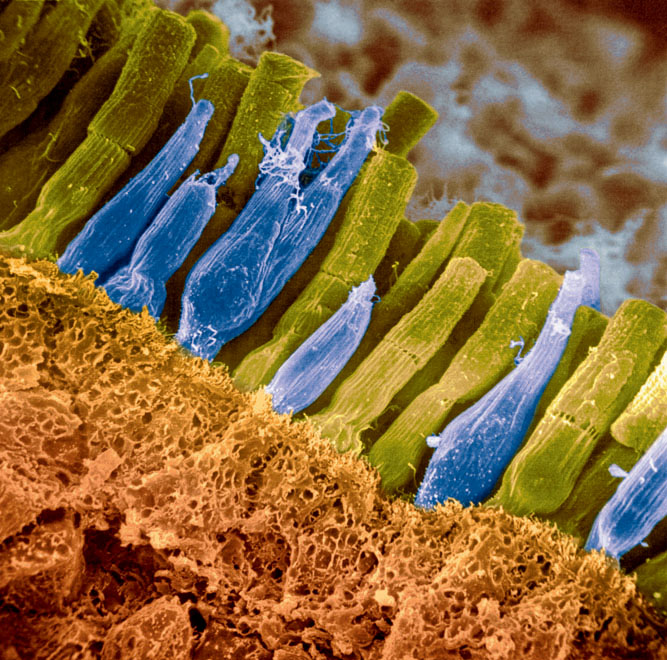
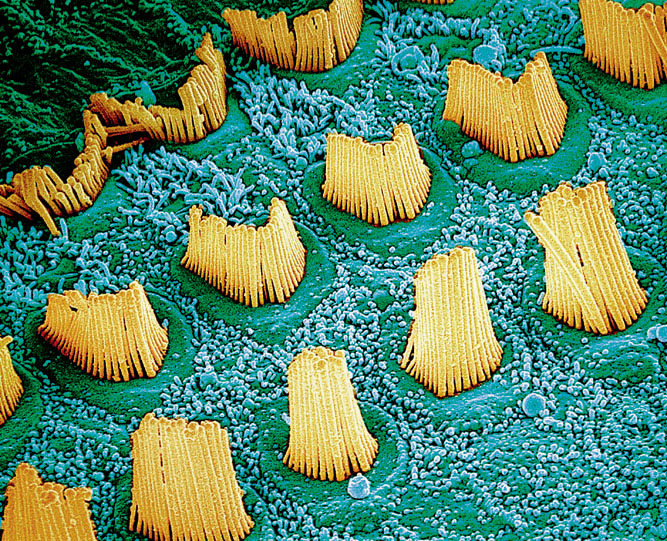
The cochlea is a snail-shaped structure in the inner ear that contains the receptor cells for hearing. Tiny hair cells that line the basilar membrane (a membrane that extends the length of the cochlea) are the receptors for hearing. There are not nearly as many hair cells in the ears as there are rods and cones in the eyes, only about 16,000 hair cells in each ear (Matlin & Foley, 1997). The vibrations of the oval window displace fluid within the cochlea, which causes movement of the basilar membrane and thus movement of the hair cells in the membrane. The auditory message is coded according to how these tiny hair cells move. This motion of the hair cells gets translated into neural impulses that get passed on to the auditory nerve cells that carry the information to the thalamus, which directs the information to the primary auditory cortex in the temporal lobes.
116
Hearing loss caused by damage to these hair cells or the auditory nerve fibers is called nerve deafness. The most common causes of such damage are aging and continued exposure to extremely loud noises. Nerve deafness is much more difficult to treat than conduction deafness, hearing loss caused by damage to the mechanical system carrying the auditory information to the cochlea. For example, puncturing an eardrum can lead to conduction deafness. Hearing aids can often help to alleviate this type of deafness.
It is important to realize that just as we learned that we only process a small part of the light spectrum, parts of the auditory spectrum are outside the range of human hearing. We cannot process ultrasound stimuli, those above 20,000 Hz, and infrasound stimuli, those below 20 Hz. Other animals, however, have different windows on the auditory world. For example, elephants, whales, and giraffes can hear infrasound stimuli; and dolphins and bats, ultrasound stimuli. Whales and elephants use infrasound to communicate over long distances, possibly up to hundreds of miles in the case of whales. Dolphins communicate using ultrasound frequencies, and bats use them to navigate and hunt in darkness. Dogs and cats can hear frequencies above 40,000 and 50,000 Hz, respectively; and the upper range for dolphins may extend to 150,000 Hz (Goldstein, 2007). Thus, the outside world is really noisy; we just lack the ability to process it.
Now, given our basic understanding of how the ear works and how auditory information gets coded and processed, we’ll consider an important aspect of this complex coding, how we distinguish different pitches.
How We Distinguish Pitch
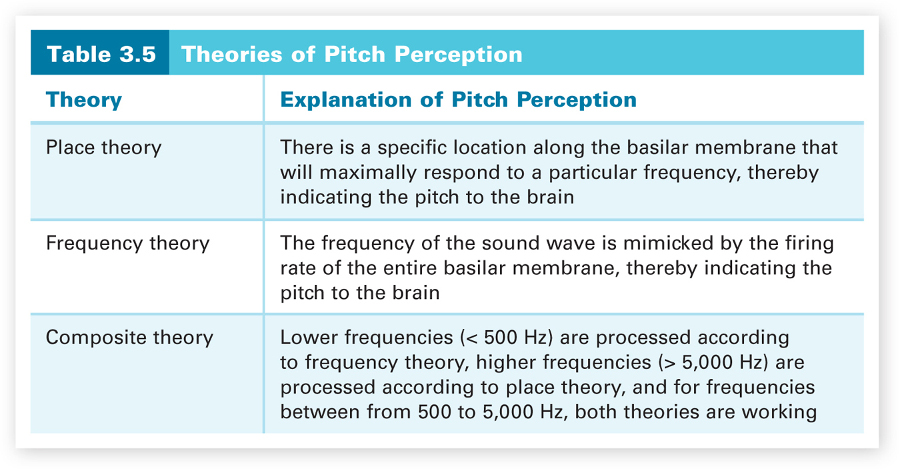
Remember that pitch is the quality of sound that we describe as high or low and is determined by the frequency of a sound wave. We can perceive sound wave frequencies from about 20 to 20,000 Hz. Each of the frequencies in this rather large range corresponds to a different pitch that we can perceive. The best explanation of how we perceive this range of pitches parallels the story of how we see different colors. We will find that to get the best explanation, two theories will need to be combined—place theory and frequency theory. First, we will consider each of the two theories, and then how they go together.
117
Place theory.
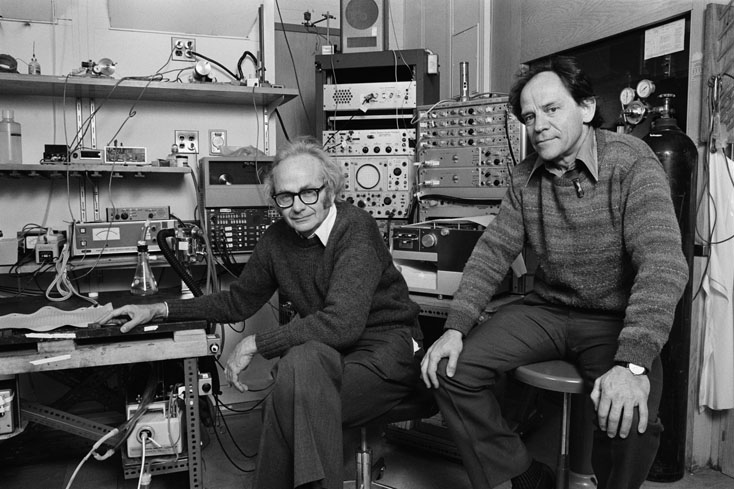
Place theory assumes that there is a specific place along the basilar membrane, starting from the oval window, which will respond maximally to a particular frequency. Thus, the brain will know the frequency by knowing the location of peak activity along the basilar membrane. In some ingenious experiments on the cochleas from human cadavers, Georg von Békésy discovered that each frequency generates a traveling wave that moves along the basilar membrane and peaks at a particular location (Békésy, 1960). Starting at the oval window and 20,000 Hz, the pitch goes down as the peak activity moves down the basilar membrane. These peak locations tell the brain the frequencies of the incoming auditory stimuli.
Frequency theory.
Frequency theory assumes that the frequency of the sound wave is mimicked by the firing rate of the hair cells across the entire basilar membrane. For example, if the frequency were 100 Hz, the firing rate for the membrane would be 100 impulses per second. The brain would know the frequency by the basilar membrane’s firing rate in reaction to the auditory stimulus.
Now let’s see why and how we put theories together to get a better explanation of pitch perception. First, research has found that specific locations along the basilar membrane correlate well with the frequencies of sound waves, except for lower pitches (< 500 Hz). For these lower pitches, the firing rate of the basilar membrane mimics the frequency. This means that place theory can explain how we hear the entire range of pitches except for low pitches, but frequency theory can explain how we hear these low pitches. Is frequency theory only able to explain how we perceive pitches below 500 Hz? No, the upper limit on firing rate is 5,000 times per second. There is a maximum firing rate for nerve cells, about 1,000 times per second. However, with the addition of the volley principle, in which the cells take turns firing to increase the maximum firing rate for the group of cells, frequency theory could explain our perception of frequencies up to about 5,000 Hz (Zwislocki, 1981). Because 5,000 times per second is the upper limit for the firing rate using the volley principle, frequency theory would not be able to explain how we perceive higher frequencies of 5,000 to 20,000 Hz.
Combining the two theories gives us a composite theory that fits the research findings on pitch perception. Frequency theory explains the perception of lower frequencies (< 500 Hz), and place theory explains how we perceive higher frequencies (> 5,000 Hz). This means that the brain uses the firing rate to differentiate the low frequencies and the location of maximal hair cell activity along the basilar membrane to distinguish the high frequencies. For the range of frequencies in between (roughly 500 to 5,000 Hz), both sources of information work, giving us double coverage and better pitch perception. This is fortunate because this range of frequencies contains the sounds most important to us—for example, human speech. All three theories of pitch perception are summarized in Table 3.5.
118
Section Summary
In this section, we discussed our two most dominant senses—vision and hearing. Stimuli for both senses occur in the form of waves, light waves and sound waves, respectively. For light waves, different wavelengths lead to the perception of different colors, and the amplitude of the wave determines the level of perceived brightness. With respect to sound waves, wave frequency determines the pitch that we perceive, and wave amplitude determines our perception of loudness. The brain cannot process such physical energy forms, hence receptor cells (rods and cones in the retina and hair cells in the basilar membrane within the cochlea) transduce (convert) the physical energy into neural signals that the brain can understand.
Light waves pass through many parts of the eye before being transduced by the rods and cones at the back of the retina. Once transduced, the neural signals are carried by the optic nerve to the thalamus, which sends them to the primary visual cortex where they are interpreted. In this interpretation process, the object is broken down into its elemental features, which are recognized by feature detectors, and then the features are combined so that the whole object can be recognized. The cones and rods divide the initial visual processing. Cones are responsible for bright light and color vision; rods are responsible for dim light and achromatic vision.
There are two competing explanations for how we see color—trichromatic theory and opponent-process theory. Trichromatic theory proposes three types of cones, each responding to ranges of wavelengths corresponding to red, green, and blue. All other colors are derived from varying proportions of these three primaries. Research indicates that we do have these three types of cones. Opponent-process theory assumes that there are three types of cell systems (red-green, blue-yellow, and black-white) at the post-receptor level that help us to see color. Being complementary pairs, the colors within each system oppose (cancel) each other. Opponent-process theory can explain complementary color phenomena that the trichromatic theory cannot. The combination of these two theories provides the best explanation of color vision. The trichromatic theory explains how the cones operate, and the opponent-process theory explains how cells in the visual pathways operate after the cones have done their initial processing.
119
The auditory system is a mechanical vibratory system with the hair cell receptors located within the basilar membrane in the cochlea. Incoming vibrations result in fluid displacement in the cochlea that causes movement of these hair cells. The nature of these hair cell movements creates the auditory message that gets carried by the auditory nerve, by way of the thalamus, to the primary auditory cortex for interpretation. Damage to these hair cells or the auditory nerve results in nerve deafness, which is very difficult to treat. Damage to one of the structures conducting the auditory information to the inner ear causes conduction deafness, which is easier to treat.
To explain how we perceive pitch, two theories are necessary. We can perceive a fairly large range of frequencies, 20 to 20,000 Hz. Place theory, which assumes that there are specific locations along the basilar membrane correlated with each frequency, explains how we hear high pitches (frequencies above 5,000 Hz). Frequency theory, which assumes that the firing rate of the hair cells mimics the incoming frequency information, explains how we hear low pitches (frequencies less than 500 Hz). Frequency theory (with the addition of the volley principle) and place theory both operate to give us better pitch perception for moderate pitches (frequencies from 500 to 5,000 Hz).
ConceptCheck | 2
 Explain the difference between nearsightedness and farsightedness with respect to focusing problems.
In nearsightedness, we have difficulty viewing distant objects because their images come into focus in front of the retina; in farsightedness, we have difficulty viewing near objects because their images come into focus behind the retina. The focusing problems could be due to defects in the lens or the shape of the eyeball.
-
Explain what opponent-process theory would predict that you would see if you stared for a minute at a flag with alternating yellow and white stripes and a rectangular patch of green in the center and then looked at a white sheet of paper.
After staring at the flag with alternating yellow and white stripes and a block of green in the middle, the yellow, white, and green parts of the three opponent-process systems would be fatigued and thus unable to oppose the blue, black, and red parts of these systems when you stared at the white sheet of paper. Thus, instead of seeing white, you would see an afterimage of a flag with alternating blue and black stripes and a block of red in the middle. Once the opposing parts of the three systems recovered, the flag afterimage would disappear, and you would see the white surface.
-
Explain why longer sound waves lead to lower frequencies and shorter ones lead to higher frequencies.
Longer wavelengths lead to lower frequencies because such wavelengths can only cycle a small number of times per second. Similarly, shorter wavelengths lead to higher frequencies because they can cycle more times per second.
-
Explain why neither the place theory nor the frequency theory by itself can explain human perception of pitch from 20 to 20,000 Hz.
Neither theory by itself can explain how we hear the entire range of pitches, 20 to 20,000 Hz, because each theory is unable to explain pitch perception for a particular part of this range. Place theory cannot explain how we perceive low pitches (< 500 Hz) because there are no places of maximal firing along the basilar membrane for these frequencies. The firing rate of the entire membrane mimicks these frequencies. Similarly, frequency theory cannot explain how we perceive high pitches, those greater than 5,000 Hz, because there is a physiological limit on the firing rate for cells. Even if the volley principle is employed, this limit is about 5,000 times per second. This means that the hair cells could not generate firing rates to match the high frequencies.