6.3 Intelligent Thinking
The types of thinking that we have discussed so far—
266
Intelligence Tests
The first attempts to develop intelligence tests took place in late nineteenth-
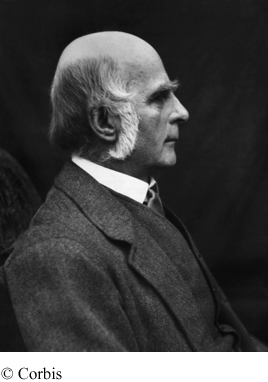
The history of intelligence tests. In late nineteenth-
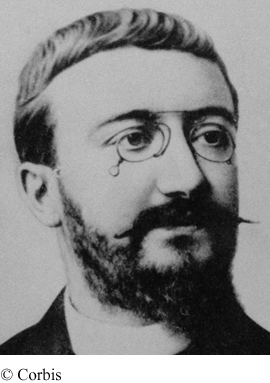
In France at the beginning of the twentieth century, Alfred Binet and his assistant Theophile Simon were working on the problem of academic retardation. France had recently introduced mass public education, and the French government asked Binet to develop a test to diagnose children whose intellectual development was subnormal and who would not be able to keep up with their peers in school. This test, published in 1905, was the first accepted test of intelligence (Fancher, 1985). The test calculated a child’s performance as an intellectual level, or mental age, that then could be used in diagnosing academic retardation. Mental age is the age typically associated with a child’s level of test performance. If a child’s mental age were less than his or her chronological (actual) age, the child would need remedial work. The fact that Binet helped in the development of “mental orthopedics”—mental exercises designed to raise the intelligence of children classified as subnormal—
267
intelligence quotient (IQ) (mental age/chronological age) × 100.
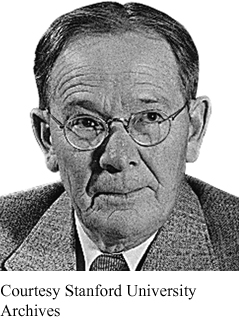
The next major figure in intelligence test development, Lewis Terman, had Galton’s nature bias, but he used Binet and Simon’s test. Working at Stanford University, Terman revised the intelligence test for use with American schoolchildren. This revision, first published in 1916, became known as the Stanford-
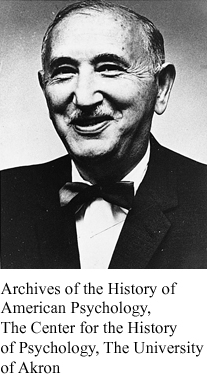
David Wechsler was working as chief psychologist at Bellevue Hospital in New York City in the 1930s and was in charge of testing thousands of adult patients from very diverse backgrounds (Fancher, 1985). Like Binet, Wechsler thought that intelligence was nurtured by one’s environment. Given that most of his patients were undereducated, he wanted to get a much broader assessment of their abilities. The Stanford-
268
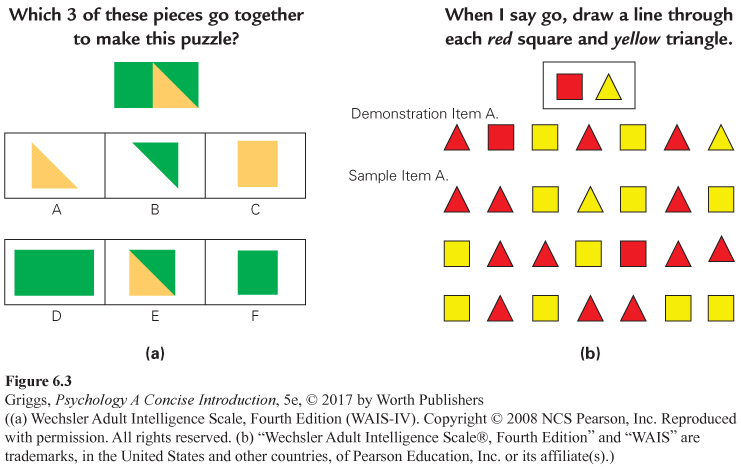
Given all of these problems, Wechsler developed his own test, the Wechsler Bellevue Scale, in 1939 (Gardner, Kornhaber, & Wake, 1996). This test became known as the Wechsler Adult Intelligence Scale (WAIS) in 1955 and is appropriate for ages 16 and older. Wechsler also developed the Wechsler Intelligence Scale for Children (WISC) in 1949 for children aged 6 to 16. Both tests (the WAIS and WISC) provide finer analyses of a person’s abilities by providing test scores for a battery of not only verbal tests (such as vocabulary and word reasoning) but also nonverbal, performance tests (such as block design, matrix reasoning, and visual puzzles). An item similar to those on the WAIS nonverbal Visual Puzzles subtest and some similar to those on the WAIS Cancellation subtest are given in Figure 6.3a and 6.3b, respectively. The WAIS is in its fourth edition, and the WISC and Stanford-
269
standardization The process that allows test scores to be interpreted by providing test norms.
Deviation IQ scores. Wechsler also devised a better way to report intelligence test scores, called deviation IQ scores. Like IQs, deviation IQs involve standardization. Standardization is the process that allows test scores to be interpreted by providing test norms. To standardize a test, the test must be given to a representative sample of the relevant population. The scores of this sample then serve as the test norms for interpretation. For example, Terman standardized the original Stanford-
deviation IQ score 100 plus or minus (15 × the number of standard deviations the person is from the raw score mean for their standardization group).
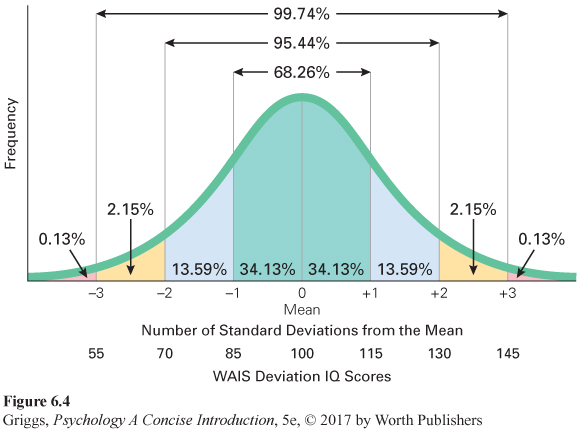
To calculate a person’s deviation IQ, Wechsler compared the person’s raw test score to the normal distribution of raw scores for that person’s standardization age group. He calculated how far the raw score was from the mean raw score in terms of standard deviation units from the mean. To make the deviation scores resemble IQ formula scores, he set the mean to 100 and the standard deviation to 15. He then defined a person’s deviation IQ score as 100 plus or minus (15 × the number of standard deviation units a person’s raw test score is from the mean for the relevant age group norms). For example, if a person’s raw test score fell 1 standard deviation above the mean for his or her age group, he or she would have a deviation IQ score of 100 plus (15 × 1), or 115. The deviation IQ scale for the WAIS is illustrated in Figure 6.4. The same scale is used for the WISC but with standardization data for various child age groups; a similar deviation IQ scale with the standard deviation set at 15 is now used for scoring the Stanford-
270
reliability The extent to which the scores for a test are consistent.
Reliability and validity. In addition to being standardized, a good test must also be reliable and valid. Reliability is the extent to which the scores for a test are consistent. This may be assessed in various ways. In the test–
If multiple forms of the test are available, then alternate-
validity The extent to which a test measures what it is supposed to measure or predicts what it is supposed to predict.
In addition to reliability, a test should have validity. Validity is the extent to which a test measures what it is supposed to measure or predicts what it is supposed to predict. The former type of validity is called content validity, and the latter, predictive validity. Content validity means that the test covers the content that it is supposed to cover. Experts decide this. All course exams should have content validity (be on the content that was assigned). Predictive validity means that the test predicts behavior that is related to what is being measured by the test; for example, an intelligence test should predict how well a child does in school. Children and teenagers higher in intelligence should do better on average than children and teenagers lower in intelligence, and this is the case for the intelligence tests that we have discussed. These tests all have good predictive validity. It is important to note that if a test is valid, then it will also be reliable. However, the reverse is not true. A test may be reliable, but not valid. A good example is measuring the circumference of the head as an indicator of intelligence. This number would be consistent across two measurements and therefore reliable, but it does not predict intelligent behavior (does not have predictive validity).
Intelligence test scores are among the most valid predictors of academic performance and job performance across just about every major occupation studied (Neisser et al., 1996; Sackett, Schmitt, Ellingson, & Kabin, 2001; Schmidt & Hunter, 1998). Not only do intelligence tests have good predictive validity, but they also are not biased against women or minorities. The tests’ predictive validity applies equally to all. It is roughly the same regardless of gender, race, ethnicity, and so on. Group differences in test scores are accompanied by comparable differences in performance. As Lilienfeld, Lynn, Ruscio, and Beyerstein (2010) point out, the belief that these tests are biased in this way is a widespread myth and the research on this belief indicates that intelligence tests and other standardized abilities tests, such as the SAT, are not biased against either women or minorities. A task force of the American Psychological Association (Neisser et al., 1996) and two National Academy of Science panels (Hartigan & Wigdor, 1989; Wigdor & Garner, 1982) reached this same conclusion. In sum, the question of intelligence test bias with respect to predictive validity has been settled about as conclusively as any scientific controversy can be (Gottfredson, 1997, 2009; Sackett, Bornerman, & Connelly, 2008).
271
Psychologists agree on what an intelligence test should predict, but they do not agree on how intelligence should be defined. Is intelligence one general ability or many specific abilities? Does intelligence involve more than just mental abilities? Are there multiple types of intelligence? Different psychologists answer these questions in different ways based on their definitions of intelligence. The other major controversy concerning intelligence is the nature–
Controversies About Intelligence
The argument over whether intelligence is a single general ability or a collection of specific abilities has been around for over a hundred years. Many theorists have argued that intelligence comprises multiple abilities, but the exact number of abilities or types of intelligence proposed has varied from 2 to over 100. In our discussion, we’ll consider a few of the more prominent theories, first considering those that propose that intelligence is one or more mental abilities and then theories that define intelligence more broadly, including more than just mental abilities as assessed by intelligence tests.
272
Theories of intelligence. Mental ability theories of intelligence began with Charles Spearman (1927), who argued that intelligence test performance is a function of two types of factors: (1) a g factor (general intelligence), and (2) some s factors (specific intellectual abilities such as reasoning). Spearman thought that the g factor was more important because it was relevant across the various mental abilities that make up an intelligence test, and that the s factors were more pertinent to specific subtests of an intelligence test.
Spearman’s theory was based on his observation that people who did well on one subtest usually did well on most of the subtests, and people who did poorly usually did so on most of the subtests. Individuals did not do equally well on all of the various subtests, however, indicating the secondary effects of the s factors or specific abilities on the various subtests. Contemporary research has shown the g factor to be a good predictor of performance both in school and at work (Gottfredson, 2002a, 2002b).
factor analysis A statistical technique that identifies clusters of test items that measure the same ability (factor).
In contrast, one of Spearman’s contemporaries, L. L. Thurstone, argued that specific mental abilities (like Spearman’s s factors) were more important (Thurstone, 1938). Based on his research, he argued that there were seven primary mental abilities—
Later, Raymond Cattell (a student of Spearman) and John Horn proposed a slightly different type of mental ability theory that has mainly influenced researchers focused on aging (Cattell, 1987; Horn & Cattell, 1966, 1967). They proposed that the g factor should be viewed as two types of intelligence: (1) fluid intelligence and (2) crystallized intelligence. Fluid intelligence refers to abilities independent of acquired knowledge, such as abstract reasoning, logical problem solving, and the speed of information processing. They defined crystallized intelligence as accumulated knowledge and verbal and numerical skills. This theory has interested researchers focused on aging because crystallized intelligence increases with experience and formal education and grows as we age; fluid intelligence is not influenced by these factors and actually declines with age. However, a recent large-
All of the theories we have discussed thus far focus on definitions of intelligence as mental abilities that can be assessed by standard intelligence tests such as the Stanford-
| Linguistic | Language ability as in reading, writing, and speaking |
| Logical- |
Mathematical problem solving and scientific analysis |
| Spatial | Reasoning about visual spatial relationships |
| Musical | Musical skills such as the ability to compose and understand music |
| Bodily- |
Skill in body movement and handling objects |
| Intrapersonal | Understanding oneself |
| Interpersonal | Understanding other people |
| Naturalist | Ability to discern patterns in nature |
273
According to Sternberg’s triarchic theory of intelligence, there are three types of intelligence—
Cognitive researcher Keith Stanovich (2009a, 2009b) argues that intelligence is a meaningful, useful construct and, unlike Gardner and Sternberg, is not interested in expanding the definition of intelligence. Rather he argues that intelligence is only one component of good thinking and thus by itself is not sufficient to explain such thinking. The other critical component is our ability to think and act rationally, which is not assessed by standard intelligence tests. Further, these two components are independent so you can be intelligent and not act rationally and vice versa. This is why smart people sometimes do foolish things. Stanovich coined the term “dysrationalia” to describe this failure to think and behave rationally despite having adequate intelligence.
274
One cause of dysrationalia is that we tend to be cognitive misers, using System 1 too much. This is the reason we have developed a whole set of heuristics and biases (many such as anchoring, representativeness, and confirmation bias were discussed earlier in this chapter) to limit the amount of reflective, analytical thinking that we need to engage in. As we have learned, these shortcut strategies provide rough and ready answers that are right sometimes but often wrong. Another source of dysrationalia is what Stanovich calls the mindware gap, which occurs when we haven’t learned the appropriate mindware (specific knowledge, such as an understanding of probability, and cognitive rules and strategies, such as scientific thinking, that are necessary to think rationally). According to Stanovich, many intelligent people never acquire the appropriate mindware. Finally, given such causes, Stanovich thinks that rational thinking and behavior can be taught and that they ought to be taught at every stage of the educational system. Richard Nisbett, in his 2015 book Mindware: Tools for Smart Thinking, provides a guide to the most essential mindware tools and how to frame common problems so that these tools can be applied to them.
The six theories of intelligence that we have discussed are briefly summarized in Table 6.2. Next we will consider the controversial nature–
| Theorist | Theory Summary |
|---|---|
| Spearman | Intelligence is mainly a function of a general intelligence (g) factor |
| Thurstone | Intelligence is a function of seven primary mental abilities— |
| Cattell and Horn | There are two types of intelligence— |
| Gardner | Intelligence is defined as eight independent intelligences— |
| Sternberg | Intelligence is defined as three types of abilities— |
| Stanovich | Intelligence is not sufficient for good thinking; rationality, which is independent of intelligence, is also necessary |
275
Nature versus nurture. Not only do psychologists disagree on the definition of intelligence, they also argue about its origins—
First, we’ll consider the results of genetic similarity studies. Genetic similarity between people varies from 100% similarity between identical twins to 50% between fraternal twins and between siblings (brothers and sisters) to 0% between two unrelated people. If intelligence were due to heredity, the average correlations between intelligence scores should decrease as genetic similarity decreases. Researchers have found this to be the case (Bouchard & McGue, 1981). The average correlation coefficient drops from 10.86 for identical twins to essentially 0 for unrelated people. The data, however, also show effects of environment. For example, if identical twins are raised apart (adopted into different families), the average correlation between their intelligence test scores drops to 10.72, indicating the importance of sharing similar environments.
Let’s consider two more of these findings to see how the effects of both heredity and environment are indicated. The average correlation between fraternal twins raised together (10.60) is less than that for identical twins reared apart (10.72), indicating the influence of heredity; but the average correlation is greater than that for ordinary siblings reared together (10.47), indicating environmental influences. Remember that the amount of genetic similarity for fraternal twins and ordinary siblings is the same, 50%. This means that the greater correlation for fraternal twins (10.60 versus 10.47) must be due to environmental factors. The fraternal twins are the same age; hence their environmental experiences are more similar than those for ordinary siblings of different ages. As these two findings indicate, heredity and environment work together to influence intelligence test scores.
Researchers have also looked at adopted children and the correlations between their scores with both their adoptive and biological parents. The modest correlation between the intelligence test scores of adopted children with their adoptive parents disappears as the children age (McGue, Bouchard, Iacono, & Lykken, 1993). The reverse is true, however, for the correlation between the scores for adopted children and their biological parents. It increases (Plomin, DeFries, McClearn, & Rutter, 1997). This stronger relationship between a person’s intelligence and that of his or her biological parents means that nature plays a larger role in determining a person’s intelligence than environmental experiences.
heritability An index of the degree that variation of a trait within a given population is due to heredity.
reaction range The genetically determined limits for an individual’s intelligence.
The results of genetic similarity studies of intelligence can also be used to estimate its heritability, an index of the degree that variation of a trait within a given population is due to heredity. These estimates vary, usually in the range from around 50% up to 70% (Bouchard, Lykken, McGue, Segal, & Tellegen, 1990). Thus, for a given population, 50% to 70% of the variation in their intelligence test scores is estimated to be due to heredity. However, because heritability is not 100%, this means that heredity and environment work together to determine intelligence (though heredity may make a larger contribution). Given this fact, recent research focuses on how heredity and environment interact to determine a person’s intelligence score. The assumption is that heredity determines a reaction range, genetically determined limits for an individual’s intelligence. Heredity places upper and lower limits on a person’s intelligence, but the quality of the person’s environment determines where the individual falls within this range. The principle is simple—
276
Two points about heritability should be made clear. First, it is a group statistic and is not relevant to individual cases. For example, if the heritability estimate for intelligence for a population were 50%, this does not mean that 50% of the intelligence of an individual in the group is determined by genetics and the other 50% by environmental experiences. It means that 50% of the variation in intelligence among people in the population is due to genetics and 50% of the variation is due to environmental experiences. Second, it is important to understand that heritability has nothing to do with the differences that have been observed between populations, such as the difference in scores for Asian schoolchildren versus American schoolchildren. Heritability only applies to the variation within a given population or group, not to variation between groups. Observed group differences must be analyzed individually and in a different way.
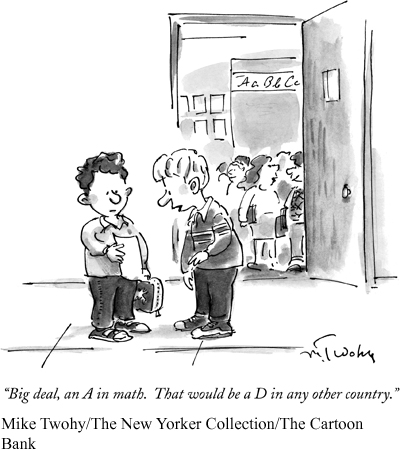
Let’s examine the gap between Asian and American schoolchildren to see one way such analyses are done (Stevenson, Chen, & Lee, 1993; Stevenson & Stigler, 1992). In this case, researchers examined the group difference for children of different ages and concluded that the gap is likely due to the priority placed on education in Asian countries. Why? There doesn’t seem to be a gap before the children enter school. The gap begins and increases as the children proceed through school. The Asian cultures place higher value on education, and so the children spend more time studying and work harder, achieving more in school and higher test scores. There seem to be clear environmental factors operating to explain this particular group difference.
Flynn effect The finding that the average intelligence test score in the United States and other industrialized nations has improved steadily over the last century.
As if there are not enough unanswered questions and debates about intelligence, a recent curious finding has led to yet another. It is called the “Flynn effect” because intelligence researcher James Flynn popularized it. The “Flynn effect” label was coined by Herrnstein and Murray in their book The Bell Curve (1994). Actually Flynn (2007) says that if he had thought to name it, he would have called it the “Tuddenham effect” because Tuddenham (1948) was the first to present convincing evidence of the effect using the intelligence test scores of U.S. soldiers in World Wars I and II. The Flynn effect refers to the fact that in the United States and other Western developed nations, average intelligence scores have improved steadily over the past century (Flynn, 1987, 1999, 2007, 2012). For example, the average score in 1918 would be equivalent to a score of 76 when compared to recent standardization norms. This translates to a gain on average of about 3 points per decade on both the Stanford-
277
Proposed explanations for the Flynn effect involve a broad range of environmental factors, from improved nutrition, hygiene, and availability of medical services to better education and smaller average family size, but the explanation of the effect still remains a source of debate, with multiple factors likely contributing to it (Neisser, 1998; Mingroni, 2014; Williams, 2013). Joining this debate, Flynn has recently proposed that the effect is not due to people getting smarter overall but rather to the fact that they are getting smarter at skills that have become more important in our society over the past century, especially abstract, scientific thinking (Flynn, 2007, 2012). Our society has changed from agriculture-
278
Pietschnig and Voracek (2015) also found that although intelligence test score gains have increased over the past few decades, the size of the gain each decade has been decreasing. Consistent with this finding, other researchers have found data that indicate that the Flynn effect may have already ended in some developed countries (for example, Denmark and Norway) but is still alive in the United States and some other developed nations such as Germany and those countries that make up the United Kingdom (Flynn, 2012; Kaufman, 2009). These findings, however, are for developed countries. Has the Flynn effect also been found for intelligence test scores in developing countries and if it has, how does it compare to that for developed countries? The findings of a recent study by Wongupparaj, Kumari, and Morris (2015) address these questions. Their meta-
Section Summary
In this section, we discussed how the first attempts at developing a valid intelligence test began with Galton in late nineteenth-
We also learned that these intelligence tests have both reliability (consistency in measurement) and predictive validity (predicting what we suppose they should predict) and are among the most valid predictors of both academic performance and job performance. In addition, research has not supported the claim that they are biased toward women or minorities.
We also considered some of the major theories of intelligence. Most of these theories define intelligence in terms of mental abilities, but differ with respect to how many abilities are proposed. Using the results of factor analysis, Spearman thought that a general intelligence factor (the g factor) was most important, but other theorists, like Thurstone, emphasized multiple, more specific abilities in their definitions. Two recent theories have attempted to broaden the conception of intelligence and another theory points to the limitations of intelligence as a sufficient explanation of good thinking. Howard Gardner has proposed a theory of eight independent types of intelligence, but critics view some of these as talents or skills and not really types of intelligence. Robert Sternberg has also attempted to broaden the conception of intelligence in his triarchic theory of intelligence, which includes analytical, creative, and practical intelligences, with the latter two having more applicability in the nonacademic world. Keith Stanovich does not want to expand the definition of intelligence but rather argues that rationality in addition to intelligence is necessary for good thinking.
279
Last, we considered the origins of intelligence. We found that genetic similarity studies indicate that both nature (heredity) and nurture (environmental experiences) are important in determining one’s intelligence. However, both heritability estimates and the results of adoption studies indicate that nature likely plays a larger role than nurture in determining intelligence. The concept of reaction range attempts to explain how heredity and environmental experiences work together to determine an individual’s intelligence—
3
Question 6.11
.
Explain why standardization of a test is necessary.
Standardization of a test is necessary for the interpretation of test performance. In the standardization process, a representative sample of the relevant population takes the test and their scores are used as the norms for the test. Test takers’ scores are compared to those of the standardization group in order to determine an index of performance. For example, on intelligence tests a person’s performance is compared to the scores for a representative sample of the person’s age group.
Question 6.12
.
Explain what a deviation IQ score is and how it differs from an IQ score.
A deviation IQ score is based on the normal distribution of scores for a person’s standardization age group. First, a person’s raw score is determined in terms of standard deviation units above or below the mean for that normal distribution. Then the person’s score in terms of standard deviation units is converted to a score that resembles an IQ score. For example, on the WAIS the mean (or 0 point) is set equal to 100 and the standard deviation to 15. Thus, a person who scores 1 standard deviation above the mean in comparison to his age group norms receives a score of 100 + 15, or 115. IQ scores were based on the following formula, IQ = (mental age/chronological age) × 100. A deviation IQ tells us how well a person did relative to the standardization data for the person’s age group. An IQ told us how well a child did relative to the child’s own actual age.
Question 6.13
.
Explain how the results of studies examining the impact of genetic similarity on intelligence support both nature and nurture explanations.
The results of genetic similarity studies support the nature (heredity) explanation of intelligence because as genetic similarity decreases, the average correlation between intelligence test scores also decreases. The average correlation is strongest for identical twins (about 0.90). However, these results also indicate that environment (nurture) plays a role. For example, the average correlation for intelligence test scores for identical twins decreases when the twins are adopted and raised apart in different environments. The twins are 100% genetically similar in both cases; therefore, environmental factors must be responsible for the difference in average correlations.
Question 6.14
.
Explain how the more contemporary theories of intelligence proposed by Gardner, Sternberg, and Stanovich differ from the more traditional theories of intelligence (e.g., those proposed by Spearman and Thurstone).
The theories proposed by Gardner and Sternberg are different from the traditional theories of intelligence that we discussed in that both theorists broaden the definition of intelligence by proposing types of intelligence that are not measured by standard intelligence tests like the WAIS and Stanford-