Concept 15.2: Mutation, Selection, Gene Flow, Genetic Drift, and Nonrandom Mating Result in Evolution
The word “evolution” is often used in a general sense to mean simply “change,” but in a biological context “evolution” refers specifically to change in the genetic makeup of populations over time. Developmental changes that occur in a single individual over the course of the life cycle are not the result of evolutionary change. Evolution is genetic change occurring in a population—a group of individuals of a single species that live and interbreed in a particular geographic area at the same time. It is important to remember that individuals do not evolve; populations do.
The premise of natural selection was one of Darwin’s principal insights and has been demonstrated to be an important process of evolution, but natural selection does not act alone. Additional processes—gene flow, genetic drift, and nonrandom mating—affect the genetic makeup of populations over time. Before we consider how these processes change the frequencies of gene variants in a population, however, we need to understand how mutation brings such variants into existence.
Mutation generates genetic variation
The origin of novel genetic variation is mutation. As described in Concept 9.3, a mutation is any change in the nucleotide sequences of an organism’s DNA. The process of DNA replication is not perfect, and some changes appear almost every time a genome is replicated. Mutations occur randomly with respect to an organism’s needs; it is natural selection acting on this random variation that results in adaptation. Most mutations are either harmful to their bearers (deleterious mutations) or have no effect (neutral mutations). But a few mutations are beneficial, and even previously deleterious or neutral alleles may become advantageous if environmental conditions change. In addition, mutation can restore genetic variation that other evolutionary processes have removed. Thus mutation both creates and helps maintain genetic variation in populations.
Mutation rates can be high, as we saw in the case of the influenza viruses described at the opening of this chapter, but in many organisms the mutation rate is very low (on the order of 10−8 to 10−9 changes per base pair of DNA per generation). Even low overall mutation rates, however, create considerable genetic variation, because each of a large number of genes may change, and populations often contain large numbers of individuals. For example, if the probability of a point mutation (an addition, deletion, or substitution of a single base) were 10−9 per base pair per generation, then each human gamete—the DNA of which contains 3 × 10⁹ base pairs—would average three new point mutations (3 × 109 × 10−9 = 3), and each zygote would carry an average of six new mutations. The current human population of about 7 billion people would thus be expected to carry about 42 billion new mutations (i.e., changes in the nucleotide sequences of their DNA that were not present one generation earlier). So even though the mutation rate in humans is low, human populations still contain enormous genetic variation on which other evolutionary processes can act.
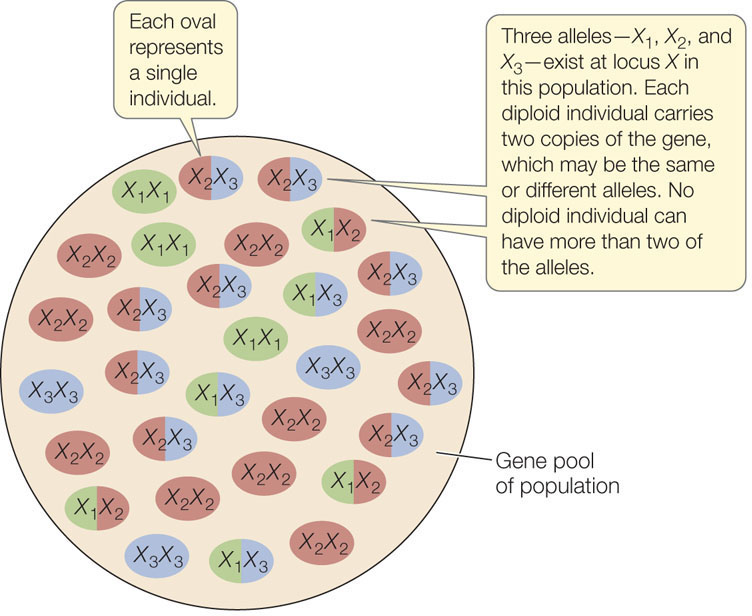
As a result of mutation, different forms of a gene, known as alleles, may exist at a particular chromosomal locus. At any particular locus, a single diploid individual has no more than two of the alleles found in the population to which it belongs. The sum of all copies of all alleles at all loci found in a population constitutes its gene pool (FIGURE 15.3). (We can also refer to the gene pool for a particular chromosomal locus or loci.) The gene pool is the sum of the genetic variation in the population. The proportion of each allele in the gene pool is the allele frequency. Likewise, the proportion of each genotype among individuals in the population is the genotype frequency.
303
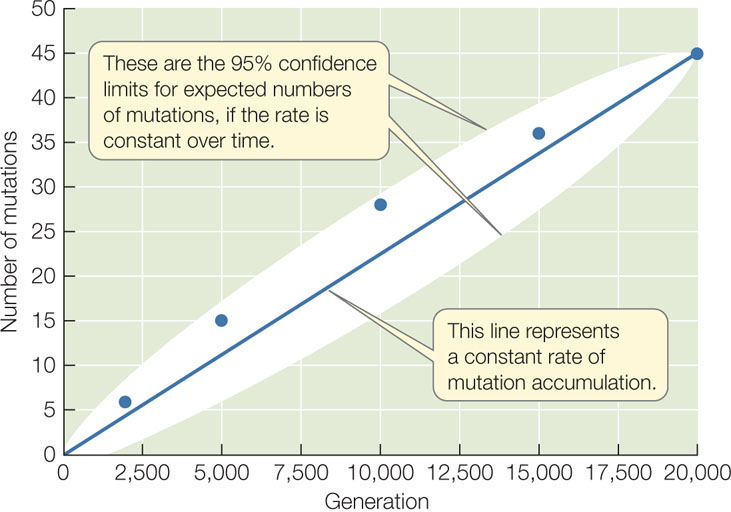
A simple experiment demonstrates how mutations accumulate in populations in a continuous, almost constant fashion over time (FIGURE 15.4). Lines of the bacterium E. coli were grown in the laboratory for 20,000 generations, and the genomes were sequenced from individuals in the experimental lines at least once every 5,000 generations. Over the experiment, the lines accumulated about 45 changes to their genomes, and these changes appeared at a fairly constant rate over time. All populations experience a similar accumulation of mutations over time (although the rate of change differs among species), and these changes provide the raw material for evolution.
LINK
Review the nature of alleles and genetic inheritance in Concepts 8.1 and 8.2
Selection on genetic variation leads to new phenotypes
As a result of mutation, the gene pools of nearly all populations contain variation for many traits. Selection that favors different traits can lead to many different lineages that descend from the same ancestor. For example, artificial selection on different traits in a single European species of wild mustard produced many important crop plants (FIGURE 15.5). Agriculturalists were able to achieve these results because the original mustard population had genetic variation for the characteristics of interest (such as stem thickness or number of leaves).

304
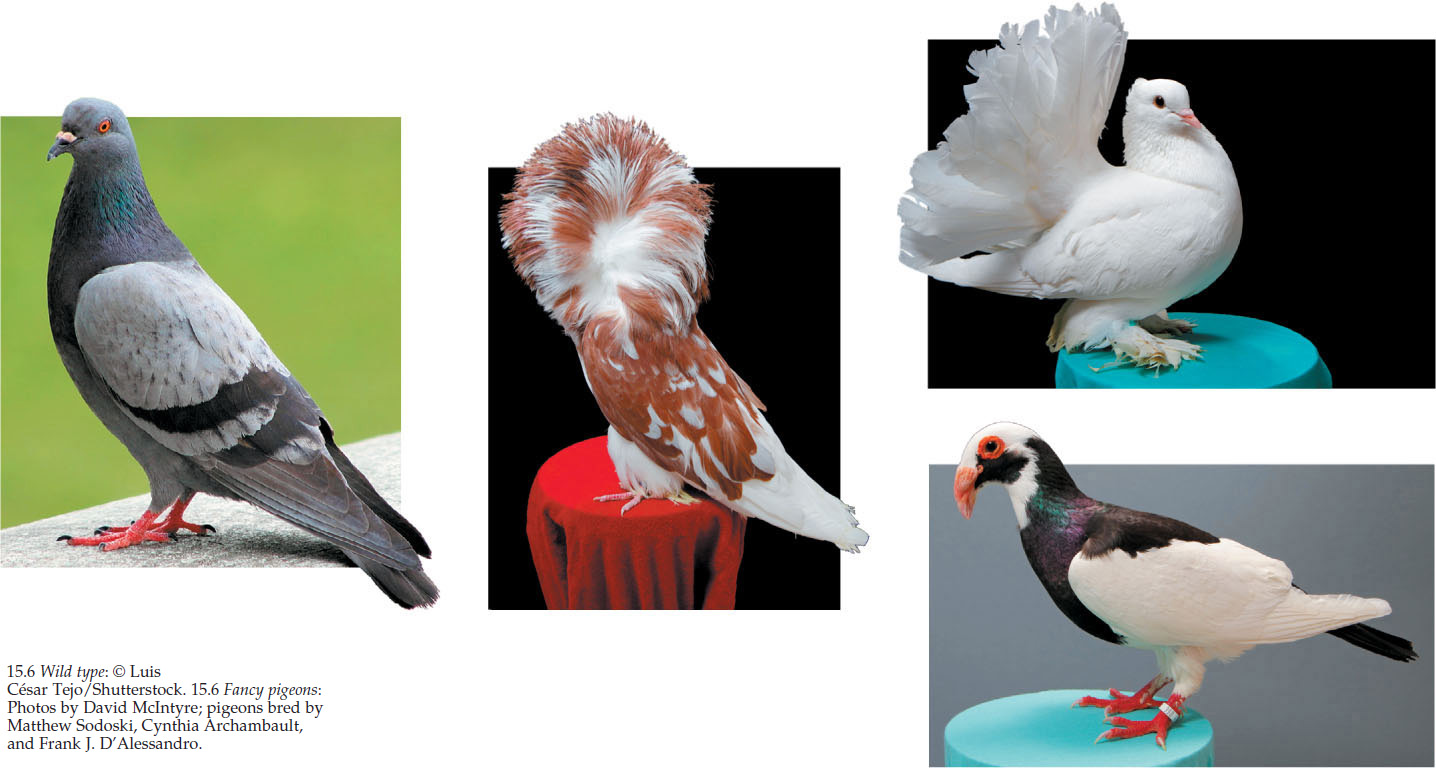
Darwin compared this artificial selection, which was commonly practiced by animal and plant breeders, with natural selection that occurred in natural populations. Many of Darwin’s observations on the nature of variation and selection came from domesticated plants and animals. Darwin bred pigeons and thus knew firsthand the astonishing diversity in color, size, form, and behavior that breeders could achieve (FIGURE 15.6). He recognized close parallels between selection by breeders and selection in nature. Whereas artificial selection resulted in traits that were preferred by the human breeders, natural selection resulted in traits that helped organisms survive and reproduce more effectively. In both cases, selection simply increased the frequency of the favored trait from one generation to the next.
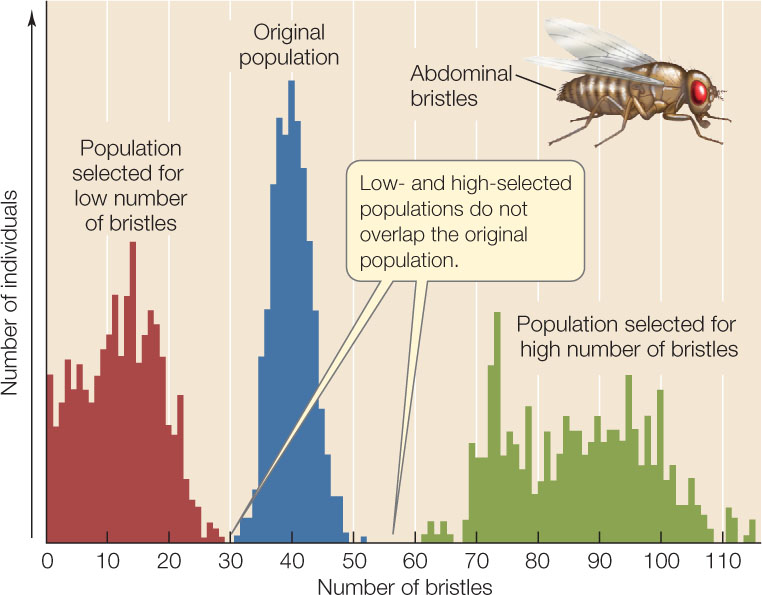
Laboratory experiments also demonstrate the existence of considerable genetic variation in populations, and show how this variation can lead to evolution through selection. In one such experiment, investigators bred populations of the fruit fly Drosophila melanogaster with high or low numbers of bristles on their abdomens from an initial population with intermediate numbers of bristles. After 35 generations, all flies in both the high- and low-bristle lineages had bristle numbers that fell well outside the range found in the original population (FIGURE 15.7). Selection for high and low bristle numbers resulted in new combinations of the many different genes that were present in the original population, so that the phenotypic variation seen in subsequent generations fell outside the phenotypic variation seen in the original population.
Natural selection increases the frequency of beneficial mutations in populations
Darwin knew that far more individuals of most species are born than survive to reproduce. He also knew that, although offspring tend to resemble their parents, the offspring of most organisms are not identical either to their parents or to one another. He suggested that slight differences among individuals affect the chance that a given individual will survive and reproduce, which increases the frequency of the favored trait in the next generation. A favored trait that evolves through natural selection is known as an adaptation; this word is used to describe both the trait itself and the process that produces the trait.
Biologists regard an organism as being adapted to a particular environment when they can demonstrate that a slightly different organism is less likely to survive and reproduce in that environment. To understand adaptation, biologists compare the performances of individuals that differ in their traits.
305
Natural selection also acts to remove deleterious mutations from populations. Individuals with deleterious mutations are less likely to survive and reproduce, so they are less likely to pass their alleles on to the next generation.
Gene flow may change allele frequencies
Few populations are completely isolated from other populations of the same species. Migration of individuals and movements of gametes (in pollen, for example) between populations—a phenomenon called gene flow—can change allele frequencies in a population. If the arriving individuals survive and reproduce in their new location, they may add new alleles to the population’s gene pool, or they may change the frequencies of alleles present in the original population.
LINK
If gene flow between two populations stops, those populations may diverge and become different species; see Concept 17.2
Genetic drift may cause large changes in small populations
In small populations, genetic drift—random changes in allele frequencies from one generation to the next—may produce large changes in allele frequencies over time. Harmful alleles may increase in frequency, and rare advantageous alleles may be lost. Even in large populations, genetic drift can influence the frequencies of neutral alleles (which do not affect the survival and reproductive rates of their bearers).
To illustrate the effects of genetic drift, suppose there are only two females in a small population of normally brown mice, and one of these females carries a newly arisen dominant allele that produces black fur. Even in the absence of any selection, it is unlikely that the two females will produce exactly the same number of offspring. Even if they do produce identical litter sizes and identical numbers of litters, chance events that have nothing to do with genetic characteristics are likely to result in differential mortality among their offspring. If each female produces one litter, but a flood envelops the black female’s nest and kills all of her offspring, the novel allele could be lost from the population in just one generation. In contrast, if the brown female’s litter is lost, then the frequency of the newly arisen allele (and phenotype) for black fur will rise dramatically in just one generation.
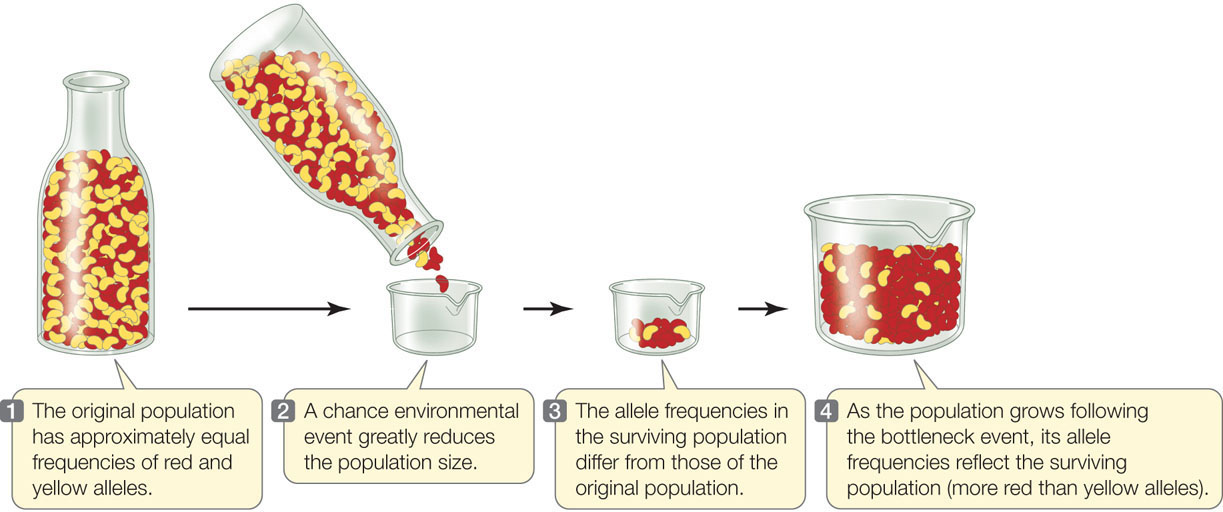
Genetic drift is especially potent when a population is reduced dramatically in size. Even populations that are normally large may occasionally pass through environmental events that only a small number of individuals survive, a situation known as a population bottleneck. The effect of genetic drift in such a situation is illustrated in FIGURE 15.8, in which red and yellow beans represent two alleles of a gene. Most of the beans in the small sample of the “population” that “survives” the bottleneck event are, just by chance, red, so the new population has a much higher frequency of red beans than the previous generation had. In a real population, the red and yellow allele frequencies would be described as having “drifted.”
A population forced through a bottleneck is likely to lose much of its genetic variation. For example, when Europeans first arrived in North America, millions of greater prairie-chickens (Tympanuchus cupido) inhabited the midwestern prairies. As a result of hunting and habitat destruction by the new settlers, the Illinois population of this species plummeted from about 100 million birds in 1900 to fewer than 50 individuals in the 1990s. A comparison of DNA from birds collected in Illinois during the middle of the twentieth century with DNA from the surviving population in the 1990s showed that Illinois prairie-chickens have lost most of their genetic diversity. Loss of genetic variation in small populations is one of the problems facing biologists who attempt to protect endangered species.
Genetic drift can have similar effects when a few pioneering individuals colonize a new region. Because of its small size, the colonizing population is unlikely to possess all of the alleles found in the gene pool of its source population. The resulting change in genetic variation, called a founder effect, is equivalent to that in a large population reduced by a bottleneck.
306
Nonrandom mating can change genotype or allele frequencies
Mating patterns often alter genotype frequencies because the individuals in a population do not choose mates at random. For example, self-fertilization is common in many groups of organisms, especially plants. Any time individuals mate preferentially with other individuals of the same genotype (including themselves), homozygous genotypes will increase in frequency and heterozygous genotypes will decrease in frequency over time. The opposite effect (more heterozygotes, fewer homozygotes) is expected when individuals mate primarily or exclusively with individuals of different genotypes.
Nonrandom mating systems that do not affect the relative reproductive success of individuals produce changes in genotype frequencies but not in allele frequencies, and thus do not, by themselves, result in evolutionary change in a population. However, nonrandom mating systems that result in different reproductive success among individuals do produce allele frequency changes from one generation to the next. Sexual selection occurs when individuals of one sex mate preferentially with particular individuals of the opposite sex rather than at random.
Sexual selection was first suggested by Charles Darwin, who developed the idea to explain the evolution of conspicuous traits that would appear to inhibit survival, such as bright colors and elaborate courtship displays in males of many species. He hypothesized that these features either improved the ability of their bearers to compete for access to mates (intrasexual selection) or made their bearers more attractive to members of the opposite sex (intersexual selection). The concept of sexual selection was either ignored or questioned for many decades, but recent investigations have demonstrated its importance.
Darwin argued that while natural selection typically favors traits that enhance the survival of their bearers or their bearers’ descendants, sexual selection is primarily about successful reproduction. An animal that survives but fails to reproduce makes no contribution to the next generation. Thus sexual selection may favor traits that enhance an individual’s chances of reproduction even when these traits reduce its chances of survival. For example, females may be more likely to see or hear males with a given trait (and thus be more likely to mate with those males), even though the favored trait also increases the chances that the male will be seen or heard by a predator.
LINK
Some of the animal behaviors that have evolved in response to sexual selection are described in Concepts 40.5 and 40.6
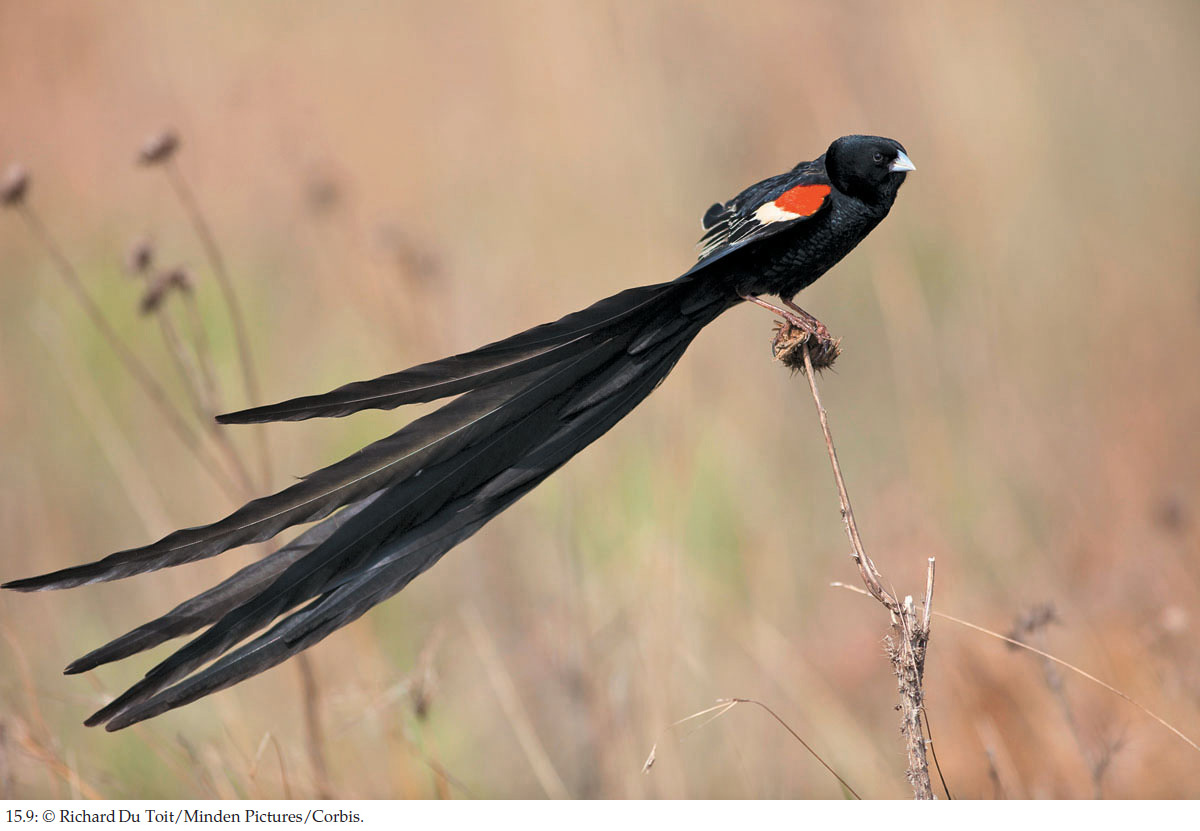
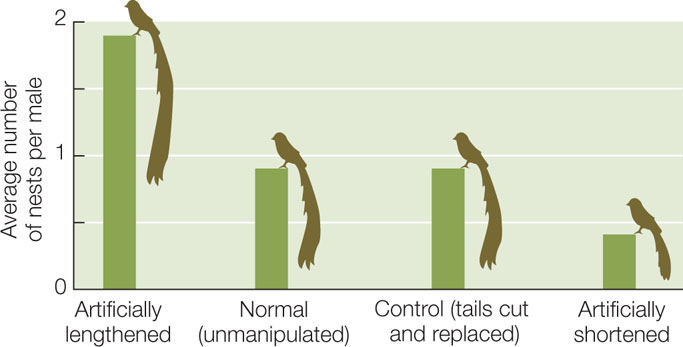
One example of a trait that Darwin attributed to sexual selection is the remarkable tail of the male African long-tailed widowbird (Euplectes progne), which is longer than the bird’s head and body combined (FIGURE 15.9). Male widowbirds normally select, and defend from other males, a territory where they perform courtship displays to attract females. To investigate whether sexual selection drove the evolution of widowbird tails, a biologist clipped the tails of some captured male widowbirds and lengthened the tails of others by gluing on additional feathers. He then cut and reglued the tail feathers of still other males, which served as controls. Both short- and long-tailed males successfully defended their display territories, indicating that a long tail does not confer an advantage in male–male competition. However, males with artificially elongated tails attracted about four times more females than did males with shortened tails (FIGURE 15.10). Thus males with long tails pass on their genes to more offspring than do males with short tails, which leads to the evolution of this unusual trait.
Investigation
HYPOTHESIS
Female widowbirds prefer to mate with the male that displays the longest tail; longer-tailed males thus are favored by sexual selection because they will father more offspring.
METHOD
- Capture males and artificially lengthen or shorten tails by cutting or gluing on feathers. In a control group, cut and replace tails to their normal length (to control for the effects of tail-cutting).
- Release the males to establish their territories and mate.
- Count the nests with eggs or young on each male’s territory.
RESULTS
Male widowbirds with artificially shortened tails established and defended display sites successfully but fathered fewer offspring than did control or unmanipulated males. Males with artificially lengthened tails fathered the most offspring.
CONCLUSION
Sexual selection in Euplectes progne has favored the evolution of long tails in the male.
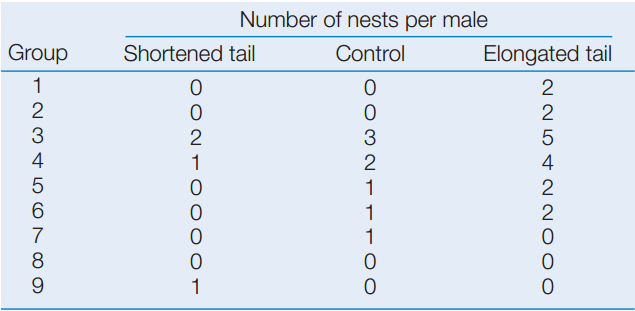
ANALYZE THE DATA
Are the differences plotted above significantly different? See Analyze the Data 15.1 in LaunchPad for a simple method to test the statistical significance of the differences using the following data.
Go to LaunchPad for discussion and relevant links for all INVESTIGATION figures.
aM. Andersson. 1982. Nature 299: 818–820.
CHECKpoint CONCEPT 15.2
- How do deleterious, neutral, and beneficial mutations differ?
- Can you explain how natural selection results in an increase in the frequency of beneficial alleles in a population over time, and a decrease in the frequency of deleterious alleles?
- How can genetic drift cause large changes in small populations?
- How do self-fertilization and sexual selection differ in their expected effects on genotype and allele frequencies over time?
The processes of mutation, selection, gene flow, genetic drift, and nonrandom mating can all result in evolutionary change. We will consider next how evolutionary change that results from these processes is measured.
307