16.3 SEGREGATION: MENDEL’S KEY DISCOVERY
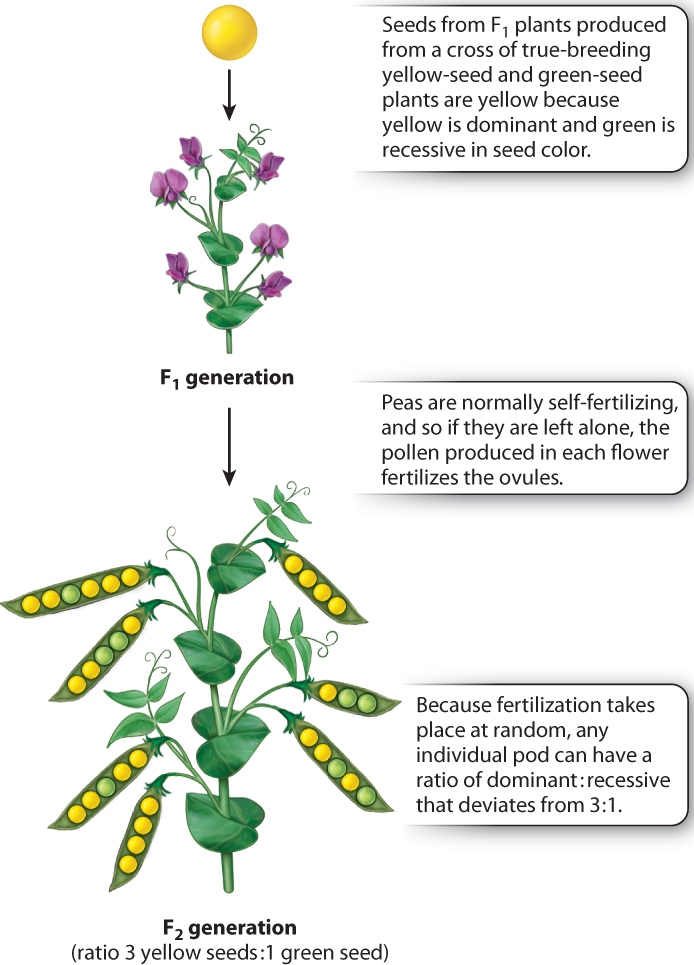
Mendel’s most important discovery was that the F1 progeny of a cross between plants with different traits did not breed true. In the F2 generation, produced by allowing the F1 flowers to undergo self-fertilization, the recessive trait reappeared (Fig. 16.6). Not only did the recessive trait reappear, it reappeared in a definite numerical proportion. Among a large number of F2 progeny, Mendel found that the dominant:recessive ratio was very close to 3:1. The results he observed among the F2 progeny for each of the seven pairs of traits are given in Table 16.1. Across experiments for all seven traits, the ratio of dominant:recessive F2 offspring was 14,949:5,010. Although there is variation from one experiment to the next, the overall ratio of 14,949:5,010 equals 2.98:1, which is a very close approximation to 3:1.
| Table 16.1: Observed F2 Ratios In Mendel's Experiments | |||
|---|---|---|---|
| TRAIT | DOMINANT TRAIT | RECESSIVE TRAIT | RATIO |
| Seed color | 6,022 | 2,001 | 3.01:1 |
| Seed shape | 5,474 | 1,850 | 2.96:1 |
| Pod color | 428 | 152 | 2.82:1 |
| Pod shape | 882 | 299 | 2.95:1 |
| Flower color | 705 | 224 | 3.15:1 |
| Flower position | 651 | 207 | 3.14:1 |
| Plant height | 787 | 277 | 2.84:1 |
16-6
16.3.1 Genes come in pairs that segregate in the formation of reproductive cells.
The explanation for the 3:1 ratio in the F2 and Mendel’s observations in general can be summarized with reference to Fig. 16.7:
Question Quick Check 1
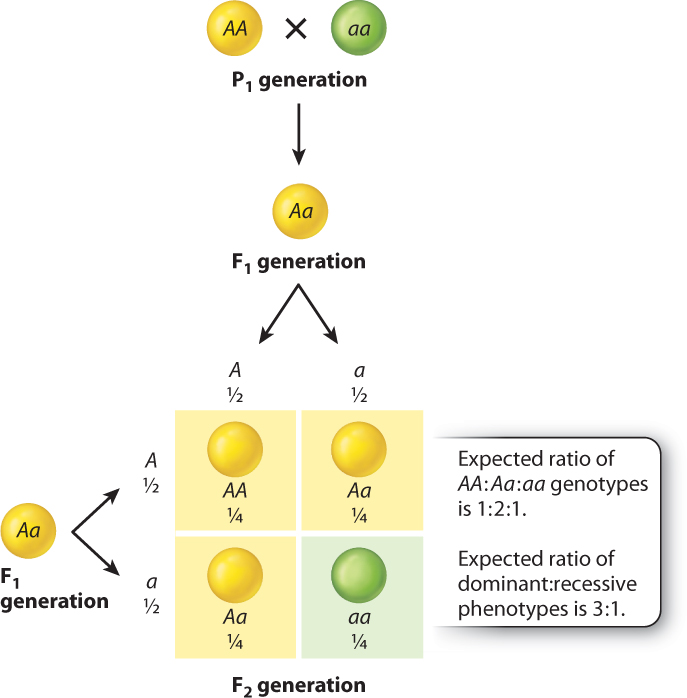
y4Ij3WlRUpJFf2EehEH4/9JABP1F1NB3Glc5GHCE3lKnL/GORGNIGM3tw0xD6UE6bxOTG6h+1cYbdujMl3Z8YzkIlQDiiAgmWOOTM8EQHerSuHwj2tutRQ==- Except for cells involved in reproduction, each cell of a pea plant contains two alleles of each gene. In each true-breeding strain constituting the P1 generation, the two alleles are identical. In Fig. 16.7, we designate the allele associated with yellow seeds as A and that associated with green seeds as a. The genotype of the true-breeding strain with yellow seeds can therefore be written as AA, and that of the true-breeding strain with green seeds as aa. The AA and aa genotypes are said to be homozygous, which means that both allele present in an individual are the same.
- Each reproductive cell, or gamete, contains only one allele of each gene. In this case, a gamete can contain the A allele or the a allele, but not both.
- In the formation of gametes, the two members of a gene pair segregate (or separate) equally into gametes, so that half the gametes get one allele and half get the other allele. This separation of alleles into different gametes defines the principle of segregation. In the case of homozygous plants (such as AA or aa), all the gametes from an individual are the same. That is, the homozygous AA strain with yellow seeds produces gametes containing the A allele, and the homozygous aa strain with green seeds produces gametes containing the a allele.
- The fertilized egg cell, called the zygote, is formed from the random union of two gametes, one from each parent. For the cross AA × aa, the zygote is an F1 hybrid formed from the union of an A-bearing gamete with an a-bearing gamete. Each F1 hybrid therefore has the genotype Aa (Fig. 16.7). The Aa genotype is heterozygous, which means that the two alleles for a given gene are different. The F1 seeds are yellow because yellow is dominant to green. Note that each F1 progeny contains an a allele because its genotype is Aa, but the phenotype of the seed is yellow and indistinguishable from that of an AA genotype.
- When the F1 progeny (genotype Aa) form gametes, by the principle of segregation the A and a alleles again separate, so that half the gametes contain only the A allele and the other half contain only the a allele (Fig. 16.7).
- In the formation of the F2 generation, the gametes from the F1 parents again combine at random. The consequences of random union of gametes can be worked out by means of a checkerboard of the sort shown in Fig. 16.7. This kind of square is called a Punnett square after its inventor, Reginald Punnett, a British geneticist.
Question Quick Check 2
SjgpxWSseDB/+N+ujk5+UMCy4IryIWkb7HW7OQswHZ+lSN45igQRmKl1NowXi40rsD9gX0OkjE96petJHx88Fqqx4Eh6WZJ71sCAXm/6yPdXjfIzPSEjQQVewUoigzn287mczBJaIZeEiqWHDnl5xiojXcUQlQmsvB15HU85w5E4QPA777nkLR5SLTI=16-7
Across the top of a Punnett square are the gametes from one parent, each with its respective frequency; and down the side are the gametes from the other parent, again each with its respective frequency. These frequencies are the probabilities of each type of gamete occurring. In the case illustrated in Fig. 16.7, both parents are F1 hybrids with the genotype Aa, and because the A and a alleles undergo segregation in the formation of gametes, half of the gametes from each parent are A and half are a.
Inside the Punnett square, each box contains the genotype of a possible zygote formed by random union of the gametes. The genotype of the zygote in each cell corresponds to the alleles in the gametes in the corresponding row and column, and the relative frequency of each zygote is obtained by multiplication of the gametic frequencies in the corresponding row and column. For example, the zygote in the top left corner in the Punnett square in Fig. 16.7 is formed by the union of an A-bearing gamete from the top and an A-bearing gamete from the side. The zygote genotype is therefore AA, and because each of the gametic types has a relative frequency of ½, the relative frequency of the AA zygote is ½ × ½ = ¼. It is the multiplication of the gametic frequencies that corresponds to the random union of gametes.
For the cross in Fig. 16.7, the boxes of the Punnett square correspond to all of the possible individuals in the F2 generation. The expected genotypes of the progeny are therefore ¼ AA, ½ Aa, and ¼ aa (or 1:2:1). When there is dominance, however, as there is in this case, the AA and Aa genotypes have the same phenotype, and so the ratio of dominant:recessive phenotypes is 3:1. The Punnett square in Fig. 16.7 illustrates the biological basis of the 3:1 ratio of phenotypes that Mendel observed in the F2 generation. Nevertheless, the underlying ratio of AA:Aa:aa genotypes is 1:2:1.
Question Quick Check 3
MrJlkdmfJI8tFmxnO2Xyvo6erWpg2uD17+973Av/xi+93C4hGFa/k5AIR/Zponf/2Kff6u8+joANeC24EDuWnzjy5BNfj3yLotHncFQQD4r094Rc79ii6DyVT7dUu9GLdd5apM6lvUiCYLgN7mcttigmOOXirZLErVA6GQ==16.3.2 The principle of segregation was tested by predicting the outcome of crosses.
The model of segregation of gene pairs (alleles) and their random combination in the formation of a zygote depicted in Fig. 16.7 was Mendel’s hypothesis, an explanation he put forward to explain an observed result. But without further experiments, he could not know if his hypothesis was right or wrong. The true test of a hypothesis is whether it can predict the results of experiments that have not yet been carried out (Chapter 1). If the predictions are correct, one’s confidence in the hypothesis is strengthened. Mendel appreciated this intuitively, even though the scientific method as understood today had not been formalized.
The Punnett square in Fig. 16.7 makes two strong predictions. The first is that the seeds in the F2 generation showing the recessive green phenotype should be homozygous aa. If the green F2 seeds have the genotype aa, then they should breed true. That is, when the seeds are grown into mature plants and self-fertilization is allowed to take place, the self-fertilized aa plants should produce only green seeds (aa). This prediction was confirmed by examining seeds actually produced by plants grown from the F2 green seeds.
The second prediction from the Punnett square in Fig. 16.7 is more complex. It has to do with the seeds in the F2 generation that show the dominant yellow phenotype. Note that although these seeds have the same phenotype, they have two different genotypes (AA and Aa). Among just the yellow seeds, ⅓ should have the genotype AA and ⅔ should have the genotype Aa, for a ratio of 1 AA:2 Aa. (The proportions are ⅓:⅔ because we are considering only the seeds that are yellow.) The AA and Aa genotypes can be distinguished by the types of seeds they produce when self-fertilized. The AA plants produce only seeds with the dominant yellow phenotype (that is, they are true breeding), whereas the Aa plants yield dominant yellow and recessive green seeds in the ratio 3:1. Mendel did such experiments, and the prediction turned out to be correct. His data confirming the 1:2 ratio of AA:Aa among F2 individuals with the dominant phenotype are shown in Table 16.2.
| Table 16.2: Genetic ratios from self-fertilization of plants showing the dominant phenotype | |||
|---|---|---|---|
| TRAIT | HOMOZYGOUS DOMINANT | HETEROZYGOUS | RATIO |
| Yellow seeds | 166 | 353 | 0.94:2 |
| Round seeds | 193 | 372 | 1.04:2 |
| Green pods | 40 | 60 | 1.33:2 |
| Smooth pods | 29 | 71 | 0.82:2 |
| Purple flowers | 36 | 64 | 1.13:2 |
| Flowers along stem | 33 | 67 | 0.99:2 |
| Tall plants | 28 | 72 | 0.78:2 |
16.3.3 A testcross is a mating to an individual with the homozygous recessive genotype.
A more direct test of segregation is to cross the F1 progeny with the true-breeding recessive strain instead of allowing them to self-fertilize. Any cross of an unknown genotype with a homozygous recessive genotype is known as a testcross.
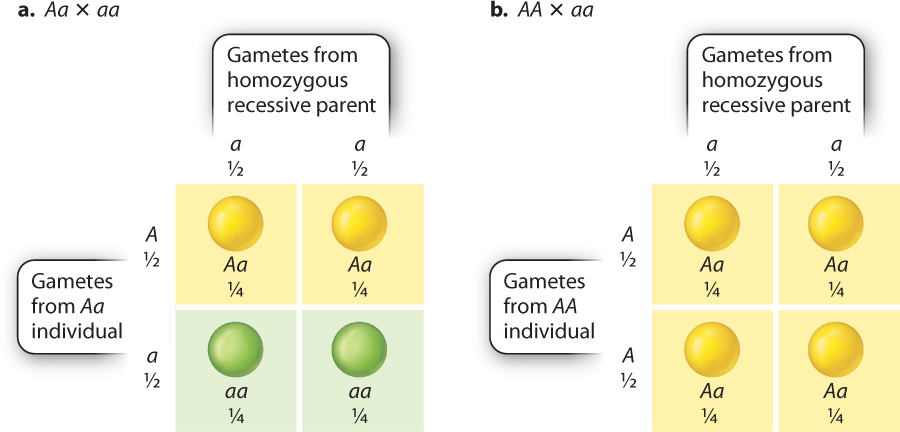
The F1 progeny show the dominant yellow seed phenotype. A yellow seed phenotype can result from either of two possible genotypes, Aa or AA. A testcross with plants of the homozygous recessive genotype (aa) can distinguish between these two possibilities (Fig. 16.8). The testcross is highly informative because the homozygous recessive parent produces only gametes carrying the recessive allele (a). In Fig. 16.8, the gametes from the homozygous recessive parent are shown across the top, and they consist only of a-bearing gametes. Down the side are gametes from the individual with the unknown genotype.
16-8
Let’s first consider what happens in a testcross to an Aa individual (Fig. 16.8a). An Aa individual produces both A-bearing gametes and a-bearing gametes. Inside the Punnett square are the predicted offspring from the testcross, which consist of ½ Aa zygotes, which yield yellow seeds, and ½ aa zygotes, which yield green seeds. By contrast, an AA individual produces only A-bearing gametes, so all the zygotes have the Aa genotype, which yields yellow seeds (Fig. 16.8b). In other words, the testcross gives different results depending on whether the parent is heterozygous (Aa) or homozygous (AA).
Note that in a testcross the phenotypes of the progeny reveal the alleles present in the gametes from the tested parent. An Aa individual yields ½ Aa (yellow seeds) and ½ aa (green seeds), since the Aa parent produces ½ A-bearing and ½ a-bearing gametes. An AA individual yields only Aa (yellow seeds), since the AA parent produces only A-bearing gametes. These results are a direct demonstration of the principle of segregation, since the ratio of the phenotypes of progeny reflect the equal segregation of alleles into gametes. Some of Mendel’s testcross data indicating 1:1 segregation in heterozygous genotypes are shown in Table 16.3.
| Table 16.3: Phenotype of progeny from testcrosses of heterozygotes | |||
|---|---|---|---|
| TRAIT | DOMINANT TRAIT | RECESSIVE TRAIT | RATIO |
| Seed color | 196 | 189 | 1.04:1 |
| Seed shape | 193 | 192 | 1.01:1 |
| Flower color | 85 | 81 | 1.05:1 |
| Plant height | 87 | 79 | 1.10:1 |
16.3.4 Segregation of alleles reflects the separation of chromosomes in meiosis.
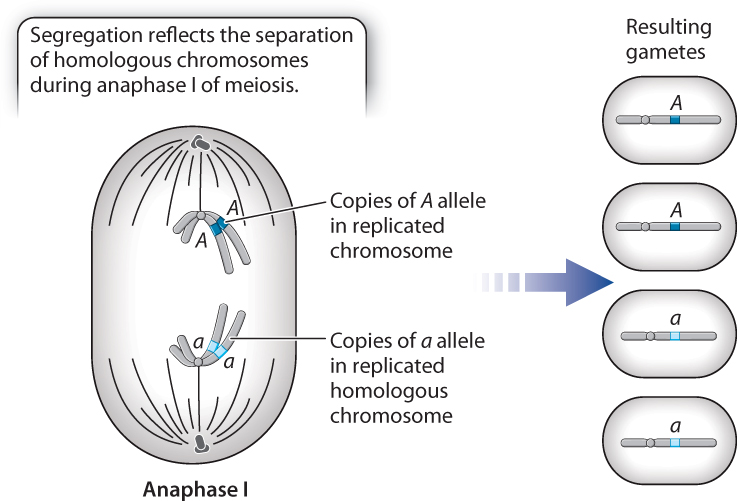
The principles of transmission genetics have a physical basis in the process of meiosis (Chapter 11). During meiosis I, maternal and paternal chromosomes (homologous chromosomes) align on the metaphase plate. Then, during anaphase I, the homologous chromosomes separate, and each chromosome goes to a different pole. Because gene pairs are carried on homologous chromosomes, segregation of alleles observed by Mendel corresponds to the separation of chromosomes that takes place in anaphase I.
Fig. 16.9 illustrates the separation of a pair of homologous chromosomes in anaphase I. In the configuration shown, the copies of the A allele (dark blue) separate from the copies of the a allele (light blue) in anaphase I. The separation of chromosomes is the physical basis of the segregation of alleles.
16.3.5 Dominance is not universally observed.
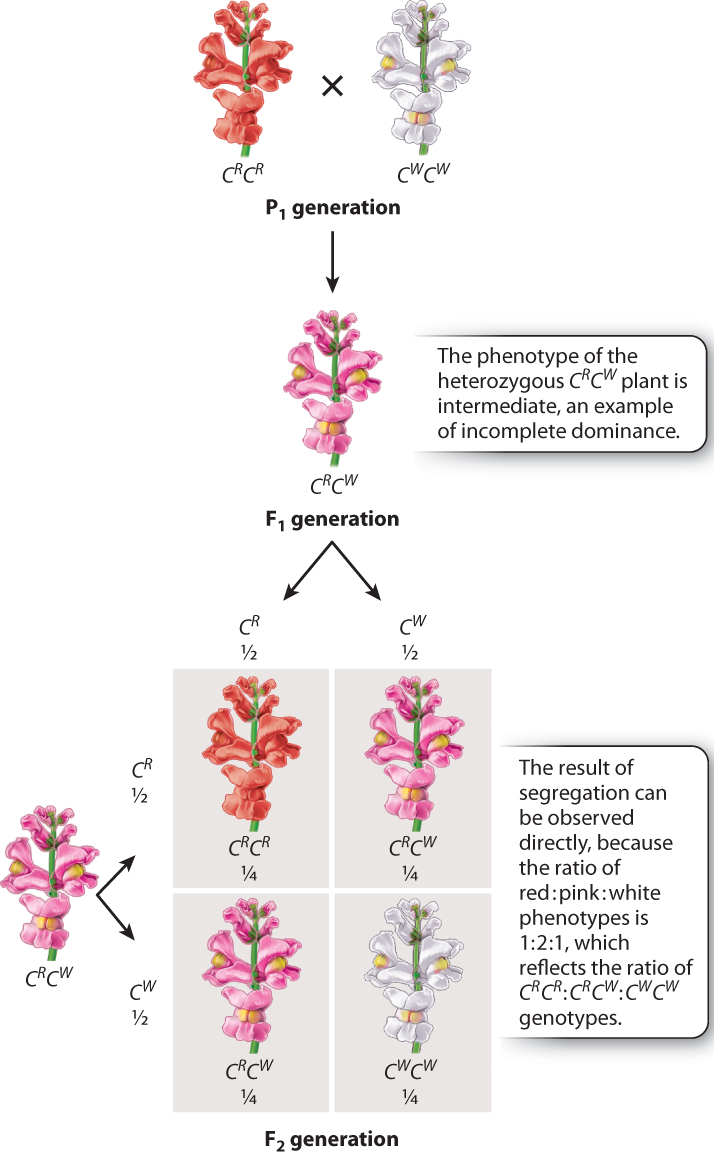
Many traits do not show complete dominance such as Mendel observed with pea plants. Instead, they show incomplete dominance, in which the phenotype of the heterozygous genotype is intermediate between those of the homozygous genotypes. In such cases, the result of segregation can be observed directly because each genotype has a distinct phenotype. An example is flower color in the snapdragon (Antirrhinum majus), in which the homozygous genotypes have red (CR CR) or white (CW CW) flowers, and the heterozygous genotype CR CW has pink flowers (Fig. 16.10). In notating incomplete dominance, we use superscripts to indicate the alleles, rather than upper-case and lower-case letters, because neither allele is dominant to the other. A cross of homozygous CR CR and CW CW strains results in hybrid F1 progeny that are pink (CRCW), and when these are crossed the resulting F2 generation consists of ¼ red (CR CR), ½ pink (CR CW), and ¼ white (CW CW).
16-9
Note that in this case the genotype ratio and the phenotype ratio are both 1:2:1, since each genotype has a distinct phenotype. Such a direct demonstration of segregation makes one wonder whether Mendel’s work might have been appreciated more readily if his traits had shown incomplete dominance!
16.3.6 The principles of transmission genetics are statistical and stated in terms of probabilities.
The element of chance in fertilization implies that the genotype of any particular progeny cannot be determined in advance. However, one can deduce the likelihood, or probability, that a specified genotype will occur. The probability of occurrence of a genotype must always lie between 0 and 1; a probability of 0 means that the genotype cannot occur, and a probability of 1 means that the occurrence of the genotype is certain. For example, in the cross Aa × AA, no offspring can have the genotype aa, so in this mating the probability of aa is 0. Similarly, in the mating AA × aa, all offspring must have the genotype Aa, so in this mating the probability of Aa is 1.
In many cases, the probability of a particular genotype is neither 0 nor 1, but some intermediate value. For one gene, the probabilities for a single individual can be deduced from the parental genotypes in the mating and the principle of segregation. For example, the probability of producing a homozygous recessive individual from the cross Aa × Aa is ¼ (see Fig. 16.7), and that from the cross Aa × aa is ½ (see Fig. 16.8a).
The probabilities for a single individual can also be inferred from observed data because the overall proportions of two (or more) genotypes among a large number of observations approximates the probability of each of the genotypes for a single observation. For example, in Mendel’s F2 data (see Table 16.1), the overall ratio of dominant: recessive is 2.98:1, or very nearly 3:1. This result implies that the probability that an individual F2 plant has the homozygous recessive phenotype is very close to ¼, which is the value inferred from the principle of segregation.
Sometimes it becomes necessary to combine the probabilities of two or more possible outcomes of a cross, and in such cases either of two rules may be helpful.
16-10
- Addition rule. This principle applies when the possible outcomes being considered cannot occur simultaneously. For example, suppose that a single offspring is chosen at random from the progeny of the mating Aa × Aa, and we wish to know the probability that the offspring is either AA or Aa. The key words here are “either” and “or.” Each of these outcomes is possible, but both cannot occur simultaneously in a single individual; the outcomes are mutually exclusive. When the possibilities are mutually exclusive, the addition rule states that the probability of either event occurring is given by the sum of their individual probabilities. In this example, the chosen offspring could either have genotype AA (with probability ¼, according to Fig. 16.7), or the offspring could have genotype Aa (with probability ½). Therefore, the probability that the chosen individual has either the AA or the Aa genotype is given by ¼ + ½ = ¾ (see Fig. 16.7). Alternatively, the ¾ could be interpreted to mean that, among a large number of offspring from the mating Aa × Aa, the proportion exhibiting the dominant phenotype will be very close to ¾. This interpretation is verified by the data in Table 16.1.
- Multiplication rule. This principle applies when outcomes can occur simultaneously, and the occurrence of one has no effect upon the likelihood of the other. Events that do not influence one another are independent, and the multiplication rule states that the probability of two independent events occurring together is the product of their respective probabilities. This rule is widely used to determine the probabilities of successive offspring of a cross, because each event of fertilization is independent of any other. For example, in the mating Aa × Aa, one may wish to determine the probability that, among four peas in a pod, the one nearest the stem is green and the others yellow. Here, the word “and” is a simple indicator that the multiplication rule should be used. Because each seed results from an independent fertilization, this probability is given by the product of the probability that the seed nearest the stem is aa and the probability that each of the other seeds is either AA or Aa, and hence the probability is ¼ × ¾ × ¾ × ¾ = 27/256, as shown for the top pod in Fig. 16.11.
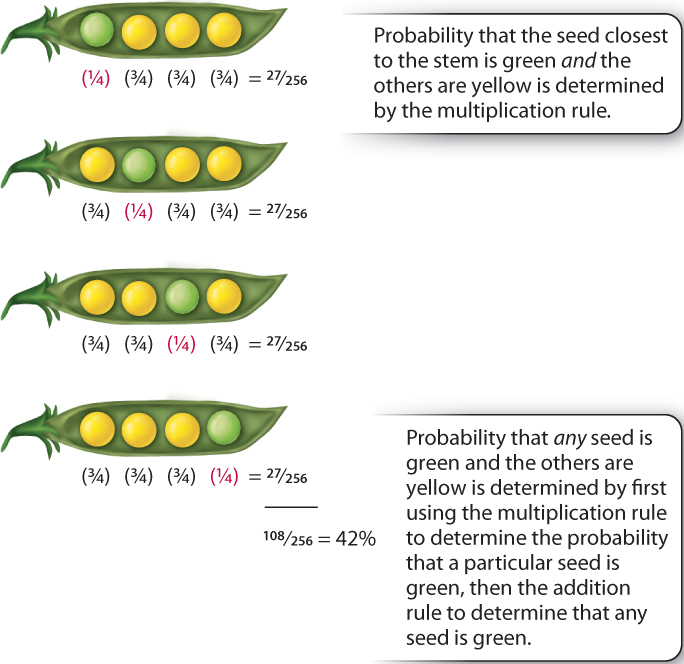
The addition and multiplication rules are very powerful when used in combination. Consider the following question: In the mating Aa × Aa, what is the probability that, among four seeds in a pod, exactly one is green? We have already seen in Fig. 16.11 that the multiplication rule gives the probability of the seed nearest the stem being green as 27/256. As illustrated in Fig. 16.11, there are only four possible ways in which exactly one seed can be green, each of which has a probability of 27/256, and these outcomes are mutually exclusive. Therefore, by the addition rule, the probability of there being exactly one green and three yellow seeds in a pod, occurring in any order, is given by 27/256 + 27/256 + 27/256 + 27/256 = 108/256, or approximately 42%.
Question Quick Check 4
om98D35IouVHUdQbVk+d0VxmPLiShd2wJewaYBP8bJlkMW4y+/qmJ/wvZz6FpvZBMTfdcqK11LwxuXGEbFDjnpuybU7R/eaJ9mJc0FGgwmo03WYOGmUiGJoxBafTlMzyICuIDaxP8QXMXoVZ4c4fKwpkpcg7jzNJZeaDsg==16.3.7 Mendelian segregation preserves genetic variation.
As noted earlier, Darwin was befuddled because blending inheritance would make genetic variation disappear so rapidly that evolution by means of natural selection could not occur. Although Darwin was completely unaware of Mendel’s findings, segregation was the answer to his problem.
The importance of segregation is that it demonstrates that the alleles encoding a trait do not alter or influence one another when they are present together in a heterozygous genotype (except in very rare instances). The recessive trait, masked in one generation, can appear in the next, looking exactly as it did in the true-breeding strains. Mendel fully appreciated the significance of this discovery. In one of his letters, he emphasized that “the two parental traits appear, separated and unchanged, and there is nothing to indicate that one of them has either inherited or taken over anything from the other.” In other words, no hint of any sort of blending between the parental genetic material takes place. Because the individual genes maintain their identity down through the generations (except for rare mutations), genetic variation in a population also tends to be maintained through time. The maintenance of genetic variation is discussed further in Chapter 21.