16.4 INDEPENDENT ASSORTMENT
We have seen that segregation of dominant and recessive alleles of a single gene results in a 3:1 ratio of dominant:recessive phenotypes in the F2 generation. What happens when the parental strains differ in two traits, for example when a strain having yellow and wrinkled seeds is crossed with a strain having green and round seeds? The results of these kinds of experiments constitute Mendel’s second key discovery, the principle of independent assortment. This principle states that segregation of one set of alleles of a gene pair is independent of the segregation of another set of alleles of a different gene pair. That is, different gene pairs assort (segregate) independently of one another.
16-11
16.4.1 Independent assortment is observed when genes segregate independently of one another.
In the cross between a strain with yellow and wrinkled seeds and a strain with green and round seeds, the phenotype of the F1 seeds is easily predicted. Because yellow is dominant to green, and round is dominant to wrinkled, the F1 seeds are expected to be yellow and round, and in fact they are (Fig. 16.12). When these seeds are grown and the F1 plants are allowed to undergo self-fertilization, the result is as shown in Fig. 16.12. Among 639 seeds from this cross, Mendel observed the following:
| yellow round | 367 |
| green round | 122 |
| yellow wrinkled | 113 |
| green wrinkled | 37 |
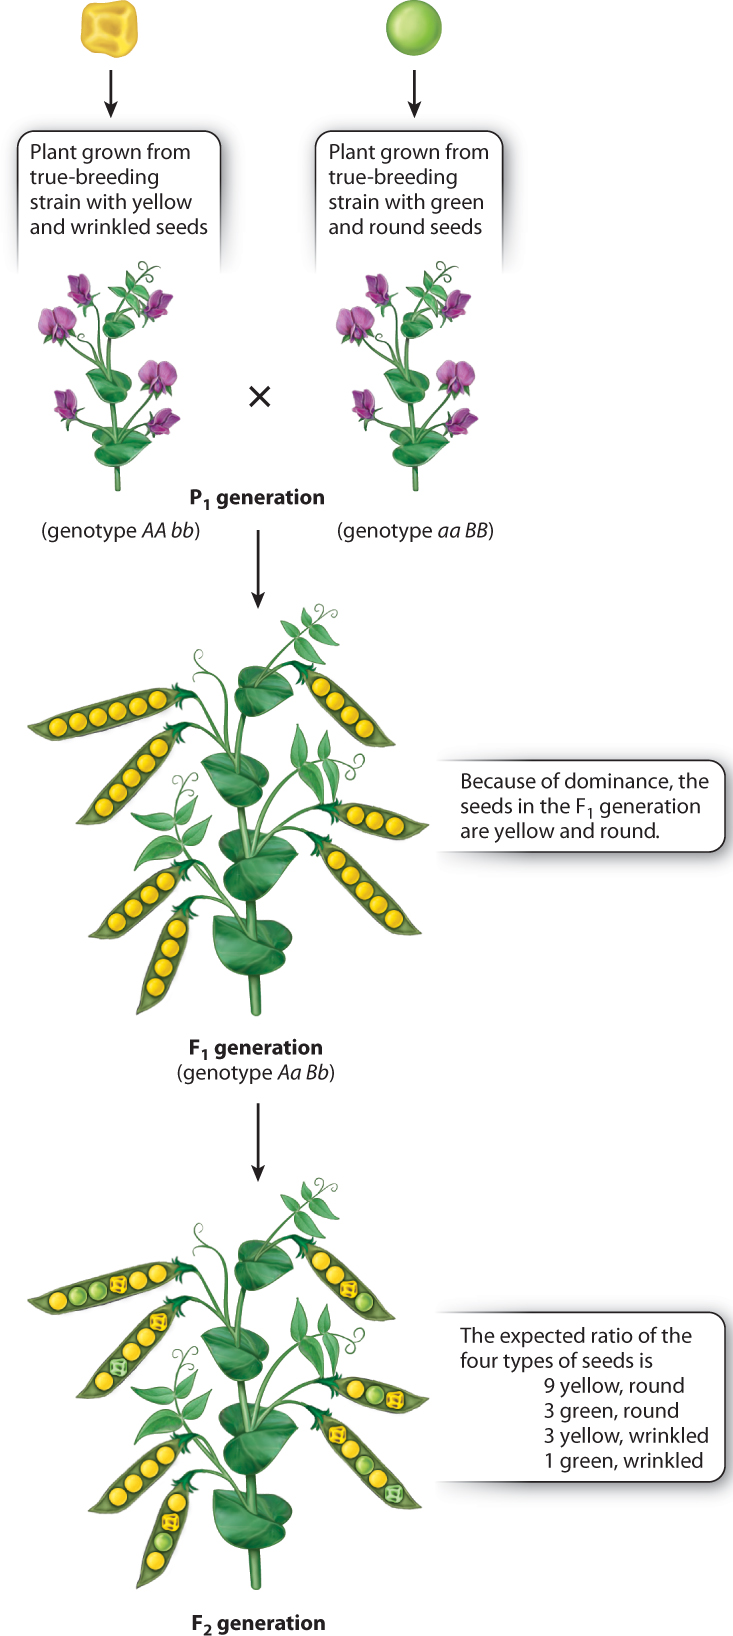
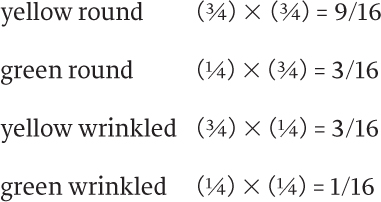
The ratio of these phenotypes is 9.9:3.3:3.1:1.0, which Mendel realized is close to 9:3:3:1. The latter ratio is that expected if the A and a alleles for seed color undergo segregation and form gametes independently of the B and b alleles for seed shape. For seed color alone we expect a ratio of ¾ yellow:¼ green, and for seed shape alone we expect a ratio of ¾ round:¼ wrinkled. If the traits are independent, then we can use the multiplication rule to predict the outcomes for both traits:
Note that 9/16:3/16:3/16:1/16 is equivalent to 9:3:3:1.
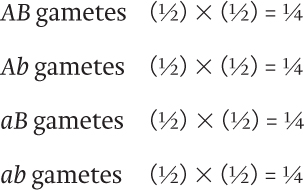
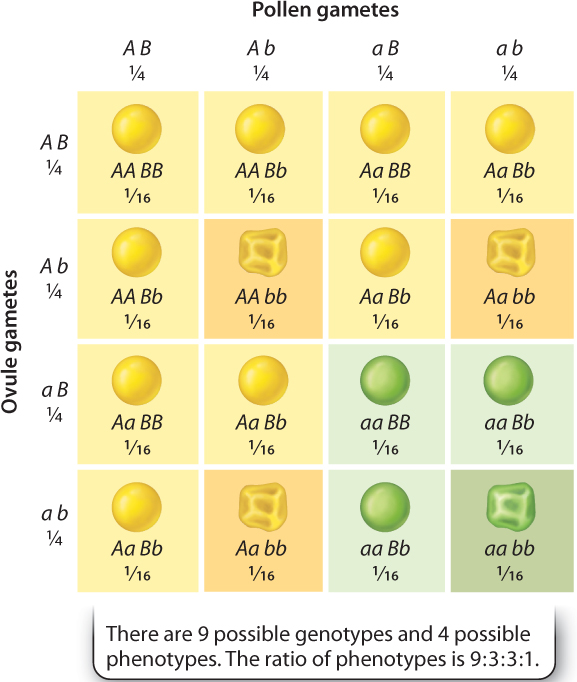
The underlying reason for the 9:3:3:1 ratio of phenotypes in the F2 generation is that the alleles for yellow versus green and those for round versus wrinkled are assorted into gametes independently of each other. In other words, the hereditary transmission of either gene has no effect on the hereditary transmission of the other. A Punnett square depicting independent assortment is shown in Fig. 16.13. The A and a alleles segregate equally into gametes as ½ A:½ a, and likewise the B and b alleles segregate equally into gametes as ½ B:½ b. The result of independent assortment is that the four possible gametic types are produced in equal proportions:
16-12
As the Punnett square in Fig. 16.13 shows, random union of these gametic types produces the expected ratio of 9 yellow round, 3 green round, 3 yellow wrinkled, and 1 green wrinkled. Fig. 16.14 summarizes how Mendel’s experiments led him to formulate his two laws.
FIG. 16.14: How are simple traits inherited?
BACKGROUND The experiments of Gregor Mendel, carried out in the years 1856–1863, are among the most important in all of biology.
EXPERIMENT Mendel set out to improve upon previous research in heredity. He writes that “among all the numerous experiments made, not one has been carried out to such an extent and in such a way as to make it possible to determine the number of different forms under which the offspring of the hybrids appear, or to arrange these forms with certainty according to their separate generations, or definitely to ascertain their statistical relations.” By studying simple traits across several generations of crosses, Mendel observed how these traits were inherited.
RESULTS The “statistical relations” became very clear. Crosses between plants that were hybrids of a single trait displayed two phenotypes in a ratio of 3:1. Crosses between plants that were hybrids of two traits displayed four different phenotypes in a ratio of 9:3:3:1.
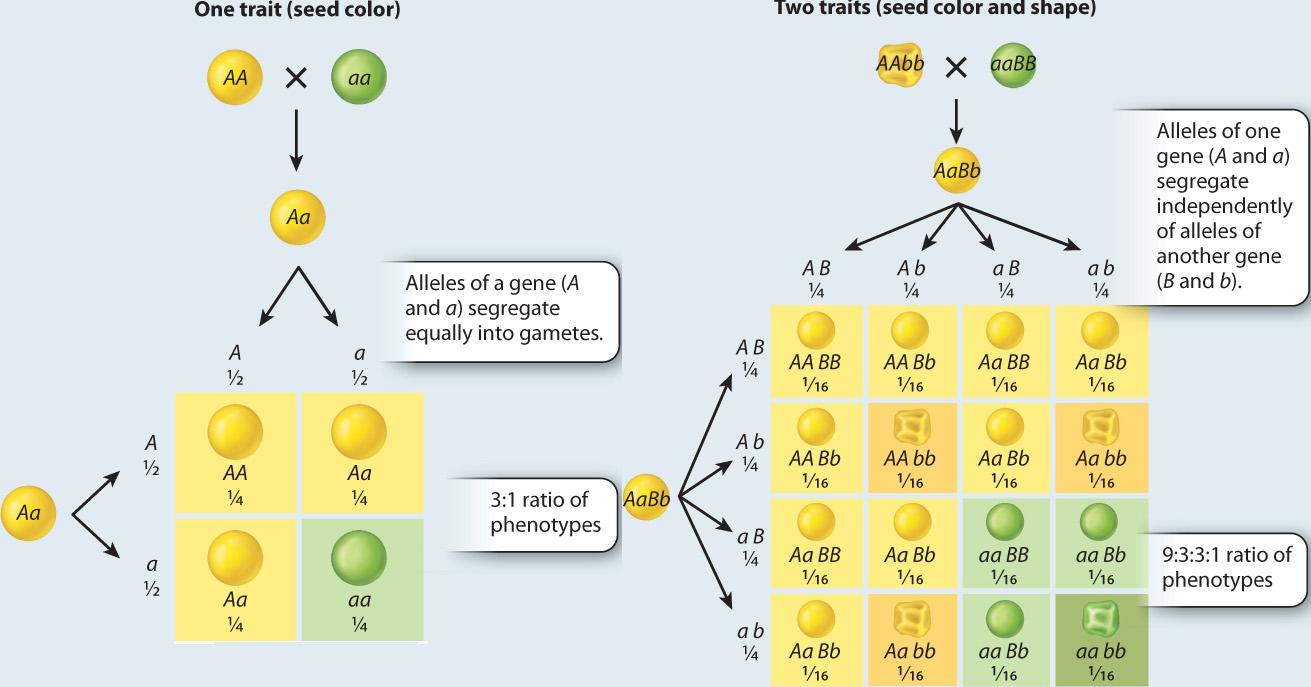
CONCLUSION From observing these ratios among several different traits, Mendel made two key conclusions, now called Mendel’s laws:
- The principle of segregation states that individuals inherit two copies (alleles) of each gene, one from the mother and one from the father, and when the individual forms reproductive cells, the two copies separate (segregate) equally in the eggs or sperm.
- The principle of independent assortment states that the two copies of each gene segregate into gametes independently of the two copies of another gene.
FOLLOW-UP WORK Mendel’s work was ignored during his lifetime, and its importance was not recognized until 1900, 16 years after his death. The rediscovery marks the beginning of the modern science of genetics.
SOURCE Mendel’s paper in English is available at http://www.mendelweb.org/Mendel.html.
16.4.2 Independent assortment reflects the random alignment of chromosomes in meiosis.
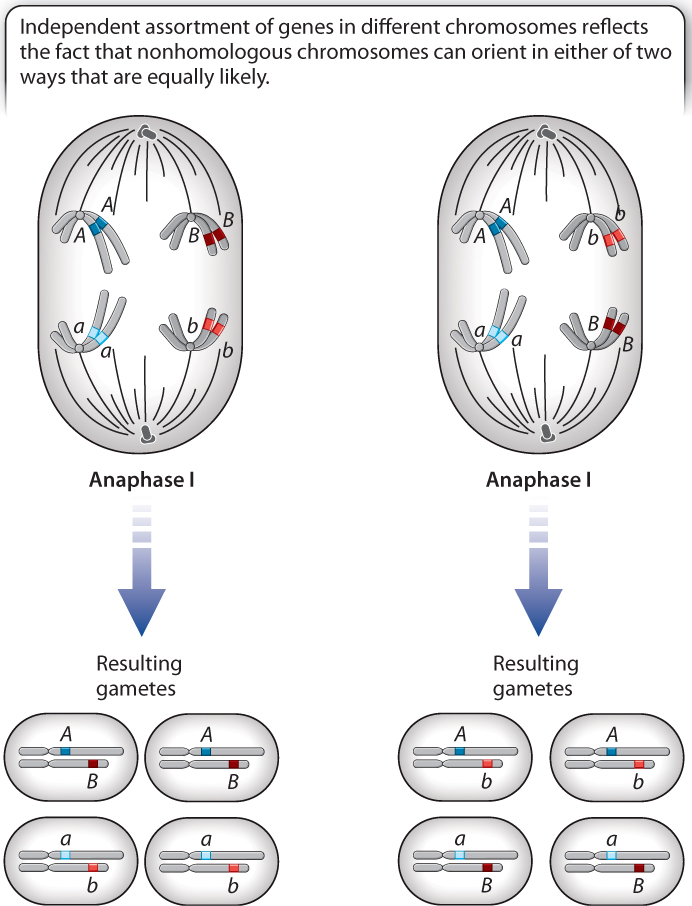
Independent assortment of genes on different chromosomes results from the mechanics of meiosis (Chapter 11), in which different pairs of homologous chromosomes align randomly on the metaphase plate. For some pairs of chromosomes, the maternal chromosome goes toward one pole, and the paternal chromosome goes to the other pole, but for other pairs, just the opposite occurs. Because the alignment is random, gene pairs on different chromosomes assort independently of one another.
16-13
Fig. 16.15 illustrates two possible alignments that are equally likely. In one alignment, the B allele (dark red) goes to the same pole as the A allele (dark blue), and in the other alignment it is the b allele (light red) that goes in the same direction as the A allele. The first type of alignment results in a 1:1 ratio of AB:ab gametes, and the second type of alignment results in a 1:1 ratio of Ab:aB gametes. Because the two orientations are equally likely, the overall ratio of AB:ab:Ab:aB from a large number of cells undergoing meiosis is expected to be 1:1:1:1. This is the principle of independent assortment for genes located in different chromosomes.
Not all genes undergo independent assortment. For example, genes that are sufficiently close together in one chromosome do not assort independently of one another. Genes in the same chromosome that fail to show independent assortment are said to be linked. Genes that are genetically linked are discussed in Chapter 17.
16-14
16.4.3 Phenotypic ratios can be modified by interactions between genes.
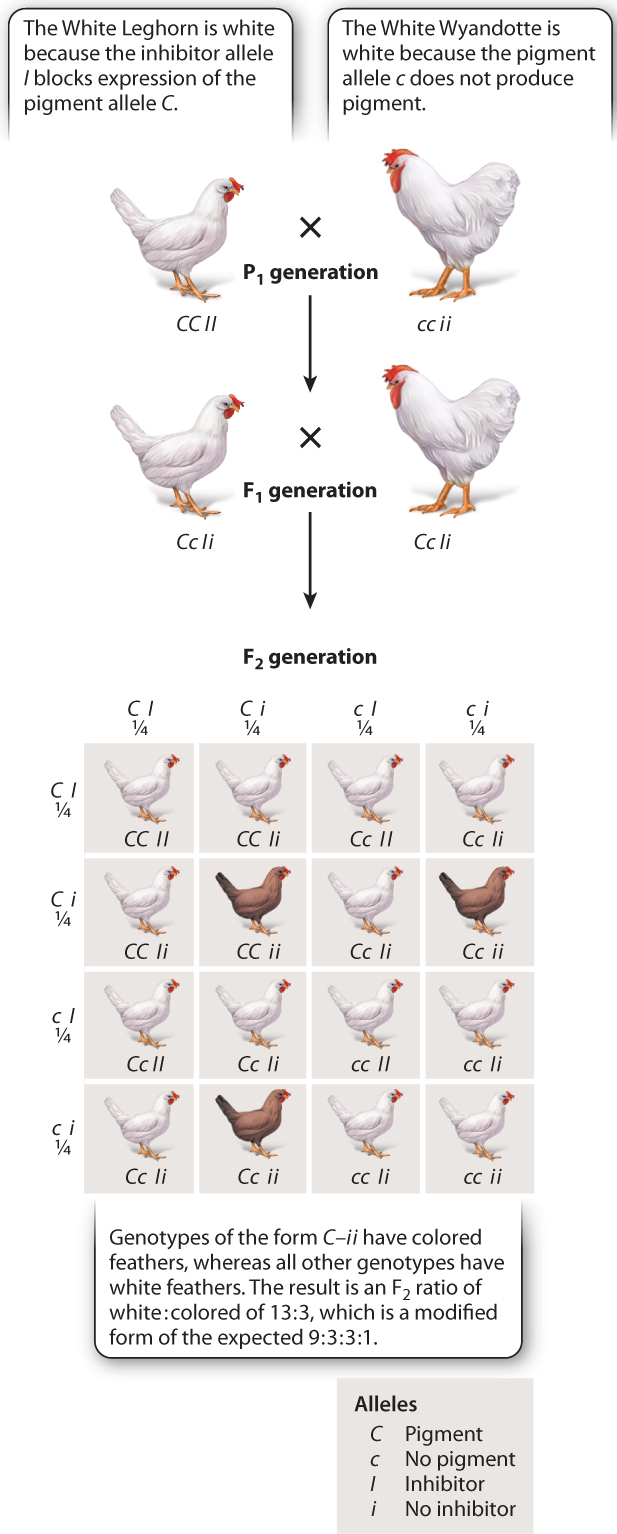
The 9:3:3:1 ratio results from independent assortment of two genes when one allele of each gene is dominant and when the two genes affect different traits. However, even with complete dominance, the ratio of phenotypes may be different if the two genes affect the same trait. In this case, the genes can interact to affect the phenotypic expression of the genotypes, resulting in a modification of the expected ratio. Genes that modify the phenotypic expression of other genes are said to show epistasis.
There are many types of epistasis leading to different modifications of the 9:3:3:1 ratio. Fig. 16.16 shows one example, in which the ratio is modified to 13:3. This ratio occurs in the F2 generation of a cross between White Leghorn and White Wyandotte chickens. Both breeds are white, but for different genetic reasons. There are two genes involved in pigment production, each with two alleles. The C gene encodes a protein that affects coloration in feathers. This gene has two alleles, the dominant allele C, which produces pigment, and the recessive allele c, which does not produce pigment. A different gene, I, codes for an inhibitor protein. The dominant allele, I, inhibits the expression of C, whereas the recessive allele, i, does not inhibit the expression of C. Therefore, the White Leghorn (genotype CC II) is white because the dominant allele I inhibits the pigment in the feathers, and the White Wyandotte (genotype cc ii) is white because the recessive allele c does not produce feather pigment to begin with. The F1 generation has genotype Cc Ii and is also white. With independent assortment, only the three C–ii offspring have colored feathers in the F2 generation (the dash indicates that the second allele could be either C or c), while the rest have white feathers, and so the ratio of white:colored is 13:3.
